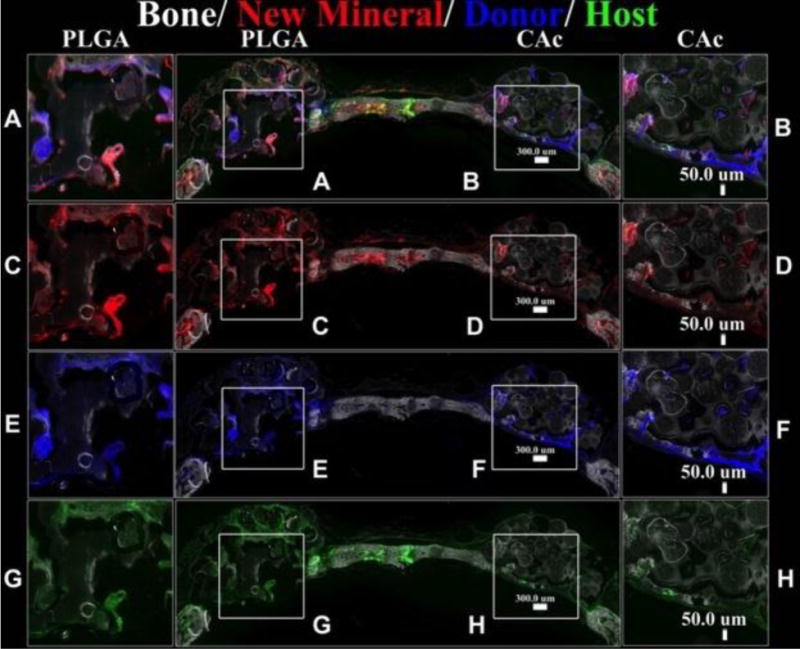
Figure 6. Fluorescent histological images of calvaria implanted with material and BMSCs at 8 weeks.

Group 2: PLGA vs CAc, Top row: DIC-Differential interference channel image to visualize bone and microspheres with AC-red labeled alizarin complexone marking new mineral deposition, Donor cells-Col3.6-Cyan (blue), Host cells-Col3.6-Tpz (green) (PLGA inset A, CAc inset B); Second row: DIC-Differential interference channel image to visualize bone and microspheres with AC-red labeled alizarin complexone marking new mineral deposition (PLGA inset C, CAc inset D). Third row: DIC-Differential interference channel image to visualize bone and microspheres with Donor cells-Col3.6-Cyan (blue) (PLGA inset E, CAc inset F). Fourth row: DIC-Differential interference channel image to visualize bone and microspheres with Host cells-Col3.6-Tpz (green) (PLGA inset G, CAc inset H).
