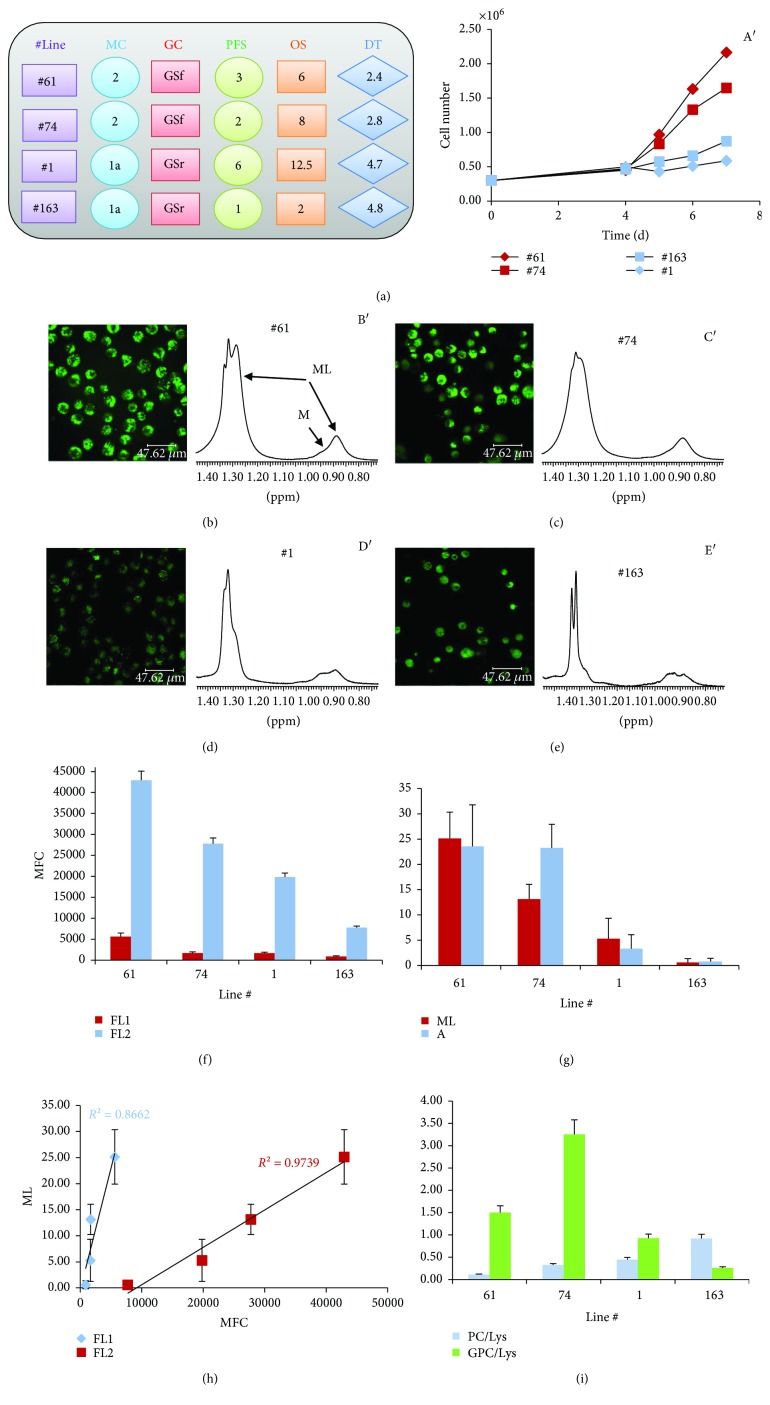
Figure 3.
Intracellular lipid droplets are detected by MRS and by ME mainly in GSCs of cluster 2. (a) Characteristics of the selected four GSC lines: metabolic and phenotypic cluster classification; progression-free survival (PFS) and overall survival (OS) of the corresponding patients; doubling time (DT) of GSCs in culture; (A′) in vitro growth curves of the four different GSC lines. Confocal microscopy images (b–e) and mobile lipid (ML) signal region from 1D 1H MR spectra (B′, C′, D′, and E′) of GSC lines #61, #74, #1, and #163, respectively; (f) mean fluorescence values (MFC), FL1 and FL2 channel, from Nile red-stained GSC samples analyzed by flow cytometry; (g) mean values (and SE) of mobile lipid signals from 1D (ML) and 2D COSY (cross peak A) MR spectra (at least three experiments for each GSC line); (h) linear correlation between fluorescence values and ML signal intensities; (i) mean values (and SE) of PC and GPC values as obtained from 2D spectra.

