
FIGURE 3.
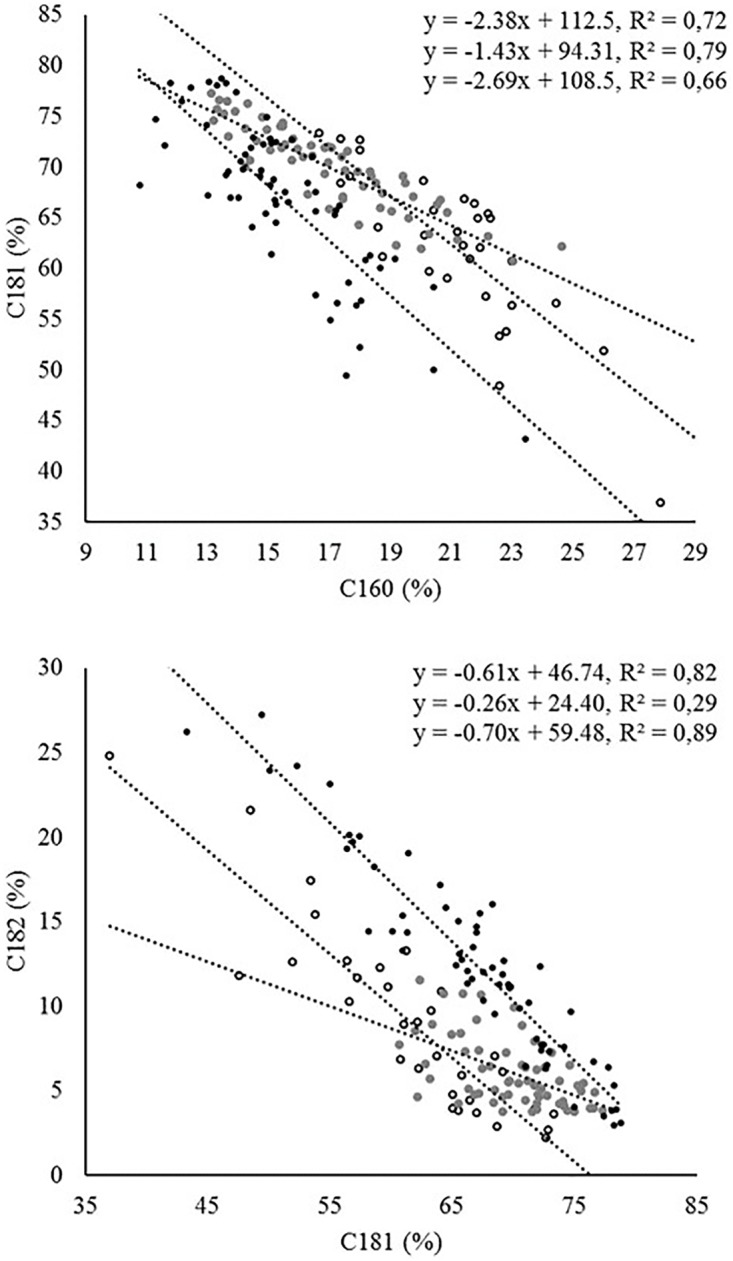
Linear regression between different fatty acid combinations in the three groups of samples: wilds (open circles), crosses (gray), and cultivars (black). Equations are presented for wilds, crosses, and cultivars from top to bottom, respectively.