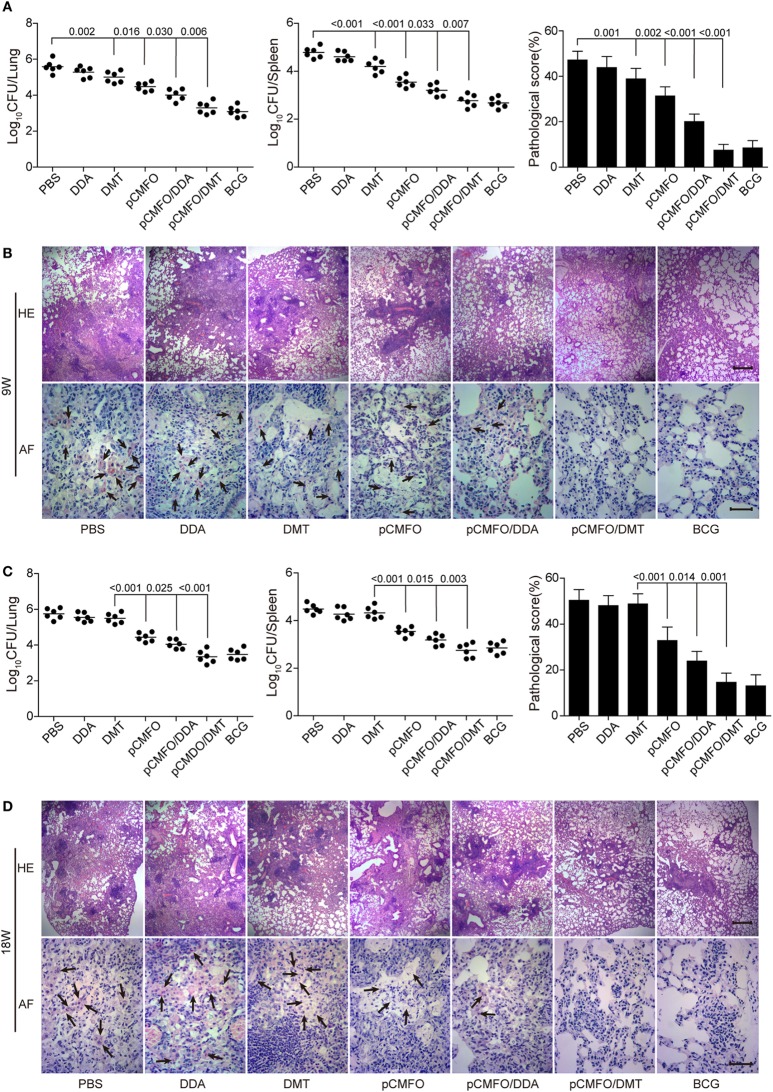
Figure 3.
Comparison of the protective efficacy between different vaccinated mice against M. tuberculosis infection (n = 6). C57BL/6 mice were challenged with aerosol about 60 CFU of virulent M. tuberculosis H37Rv strain, 9 (A,B) and 18 (C,D) weeks after immunization. Four weeks post-challenge, the bacterial load in the lung and spleen of each mouse was enumerated. Results are shown as mean of log10 CFU ± SEM per organ of different groups. A p-value for the indicated comparisons is shown on the bar. Lung tissue sections were also prepared for hematoxylin-eosin (HE) staining (scale bar, 400 µm) and acid-fast (AF) staining (scale bar, 50 µm), respectively. Arrows indicate AF staining positive bacteria.

