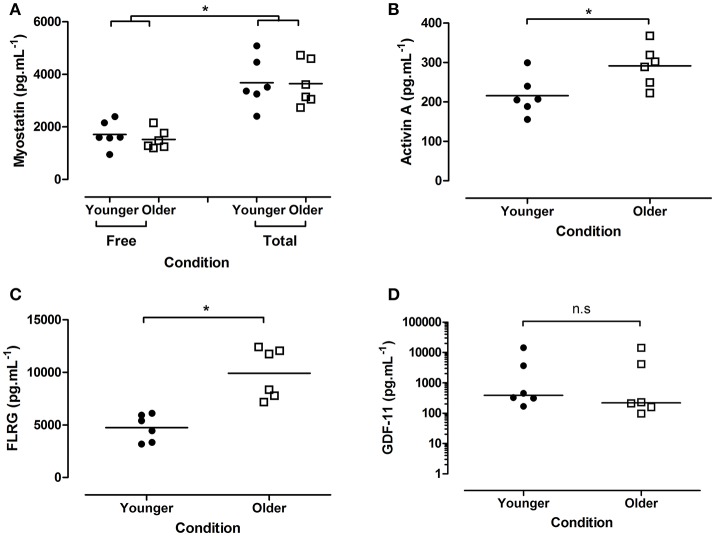
Figure 1.
Concentration of plasma endocrine factors from younger and older participants. (A) Myostatin (free and total), (B) activin A, (C) FLRG, and (D) GDF-11 (all pg.mL−1). Data are presented as grouped dot plots, with horizontal lines indicated mean in panels (A–C), median in panel (D). Note panel (D) is presented on a logarithmic y axis. N = 6 per group, closed circles indicate younger, open squares older participants. *Indicates significant differences as marked.

