Figure 3.

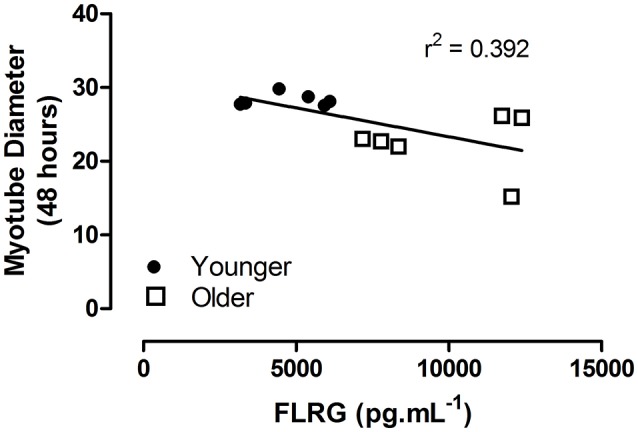
Myotube diameter at 48 h post plasma stimulation as a function of in vivo plasma concentration of FLRG (pg.mL−1). Linear regression indicated, independent of age group. Closed circles indicate younger, open squares older participants.

Myotube diameter at 48 h post plasma stimulation as a function of in vivo plasma concentration of FLRG (pg.mL−1). Linear regression indicated, independent of age group. Closed circles indicate younger, open squares older participants.