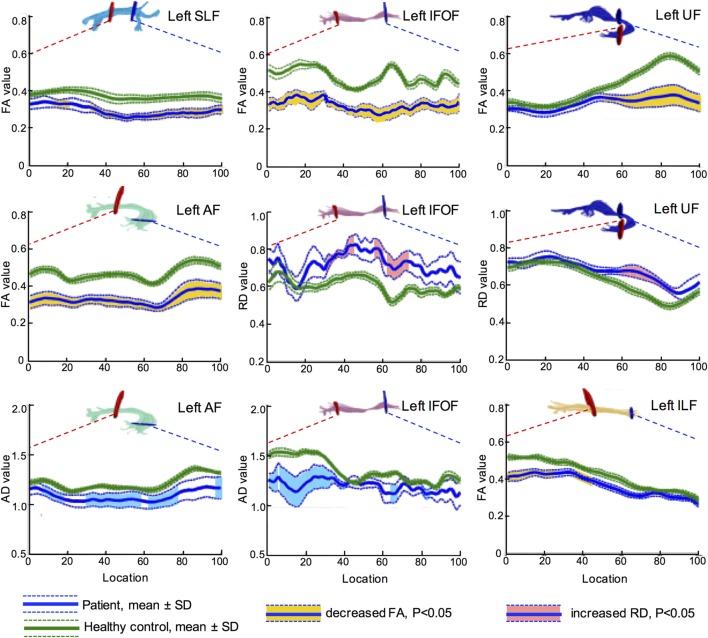
Figure 4.
Point-wise comparisons for diffusion measurement along the tract trajectory between patients and controls. The horizontal scale represents 100 equidistant nodes along the central portion of the tract, defined by the red starting point and blue point. The blue solid line refers to the mean value of patient group, while the green solid line refers the mean value of control group. The dash lines stand for their SD. The vertical scale refers to diffusion metrics, and the segments with significant difference are marked in different colors, yellow for FA, light blue for AD, and pink for RD (all corrected p < 0.05). Values of AD and RD are measured in square millimeter per second × 10−3. FA, fractional anisotropy; RD, radial diffusivity; AD, axial diffusivity; IFOF, inferior fronto-occipital fascicle; ILF, inferior longitudinal fascicle; UF, uncinate fascicle; SLF, superior longitudinal fascicle; AF, arcuate fascicle.

