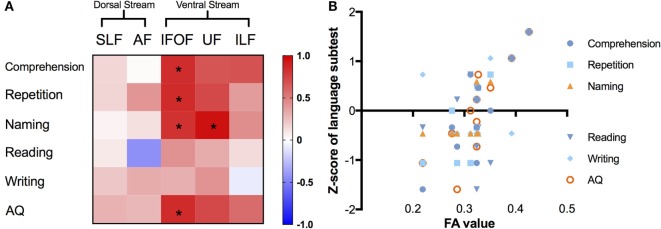
Figure 5.
Correlations between different language subcomponents and mean FA value of the left major fascicles. (A) Correlation matrix with a color scale, squares in red mean positive correlations while blue ones mean negative correlations, asterisks denote significant correlations (all corrected p < 0.05). (B) Correlation scatter plots for the left IFOF, presenting the relationships between FA values (x-axis) and Z-scores of language subtests on the y-axis. FA, fractional anisotropy; IFOF, inferior fronto-occipital fascicle; ILF, inferior longitudinal fascicle; UF, uncinate fascicle; SLF, superior longitudinal fascicle; AF, arcuate fascicle; AQ, aphasia quotient.

