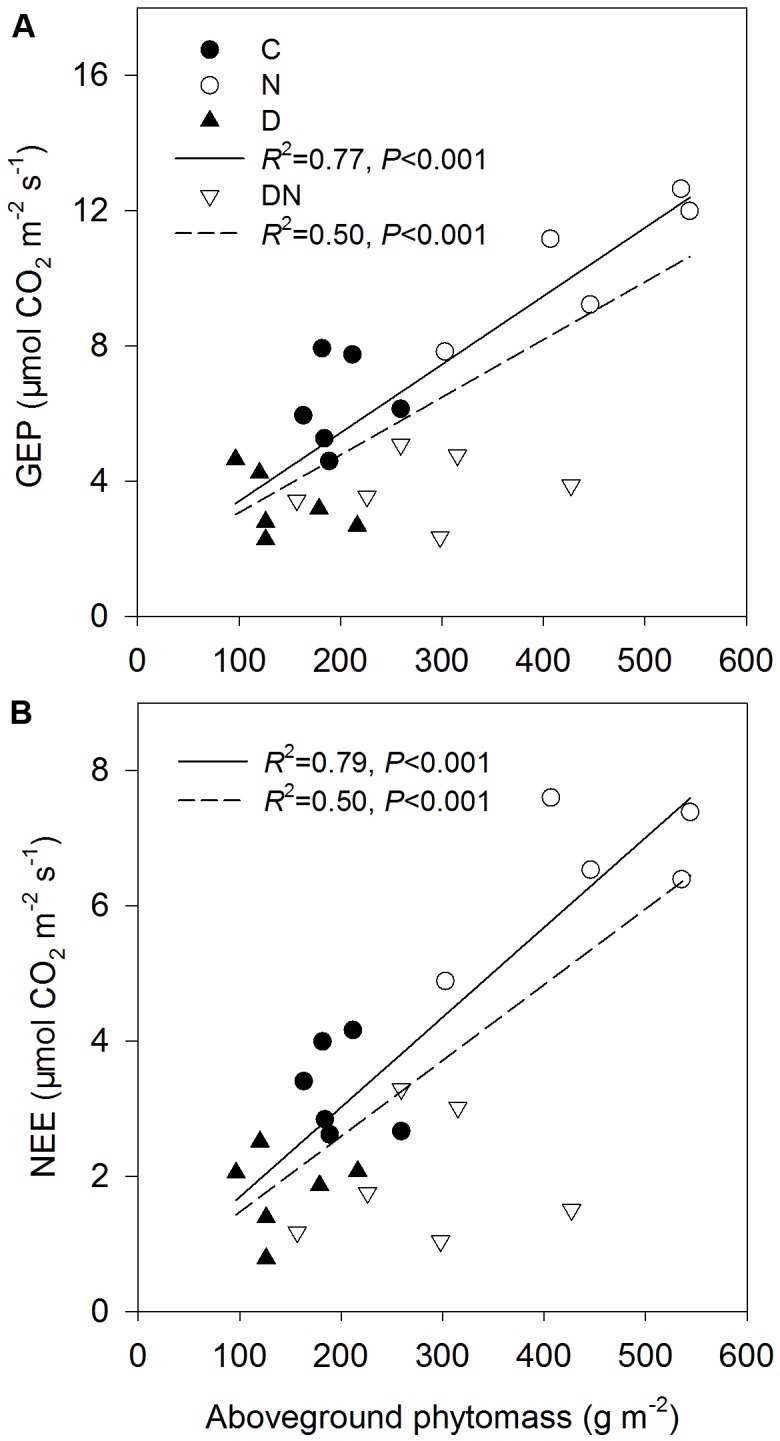
FIGURE 5.

Relationships between gross ecosystem productivity (GEP) (A) and ecosystem CO2 exchange (NEE) (B) and aboveground phytomass across all the treatments except DN treatment (solid line) and all the treatments (dash line) at the end of the drought period (DOY 196 in 2015).
