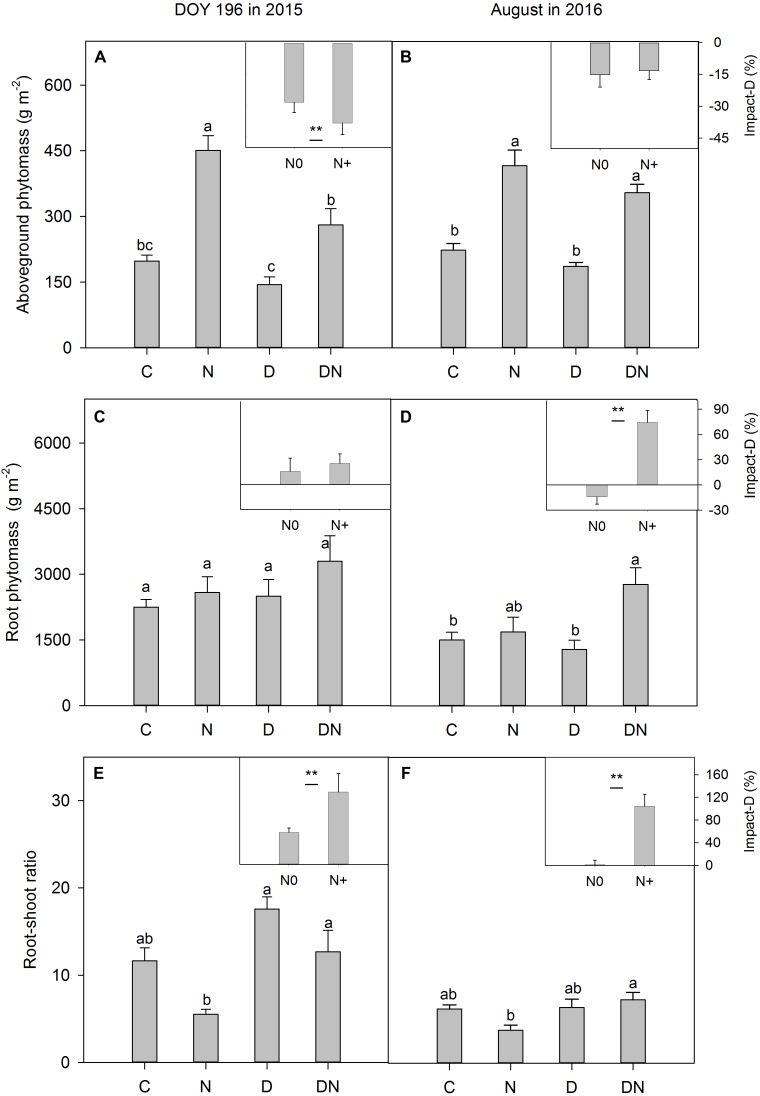
FIGURE 6.
Responses of (A,B) aboveground phytomass, (C,D) root phytomass and (E,F) root-shoot ratio to four treatments (C, control; N, nitrogen addition; D, drought; DN, nitrogen addition plus drought) at the end of the drought period (DOY 196 in 2015) and 1 year after the drought event (August in 2016). Impact-D = (XD – XC)/XC × 100, or = (XDN – XN)/XN × 100, where X indicates aboveground phytomass, root phytomass or root-shoot ratio. Different letters and asterisk indicate significant differences between the treatments (P < 0.05). The error bars represent standard errors of means (n = 6).

