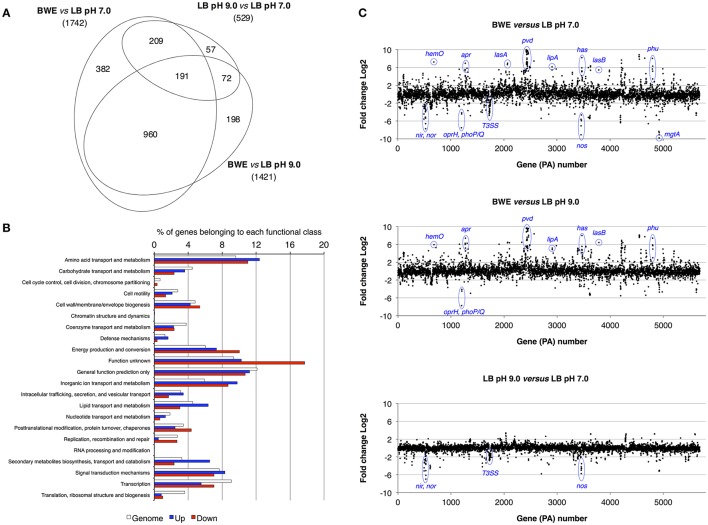
Figure 1.
Characterization of P. aeruginosa gene expression. (A) Venn diagram showing the significantly differentially regulated genes (FDR < 5%) with a threshold fold change 2 (FC 2). Comparative expressions were performed for BWE vs. LB pH 7.0, BWE vs. LB pH 9.0, and LB pH 9.0 vs. LB pH 7.0. The elliptic Venn diagram was generated using eulerAPE software (Micallef and Rodgers, 2014). (B) Histograms representing the distribution of genes according their functional classes for P. aeruginosa whole genome (PAO1_genome) and for the up-regulated (Up) and down-regulated (Down) genes among the 960 differentially expressed both in BWE vs. LB pH 7.0 and pH 9.0. Data on the functional classes are from the Pseudomonas Genome Database (Winsor et al., 2016). (C) P. aeruginosa WT relative gene expression between BWE, LB pH 7.0, and LB pH 9.0 growth conditions. Gene annotation numbers are from the Pseudomonas Genome Database. Some significant up- and down-regulated genes discussed in the article are highlighted.

