Figure 2.
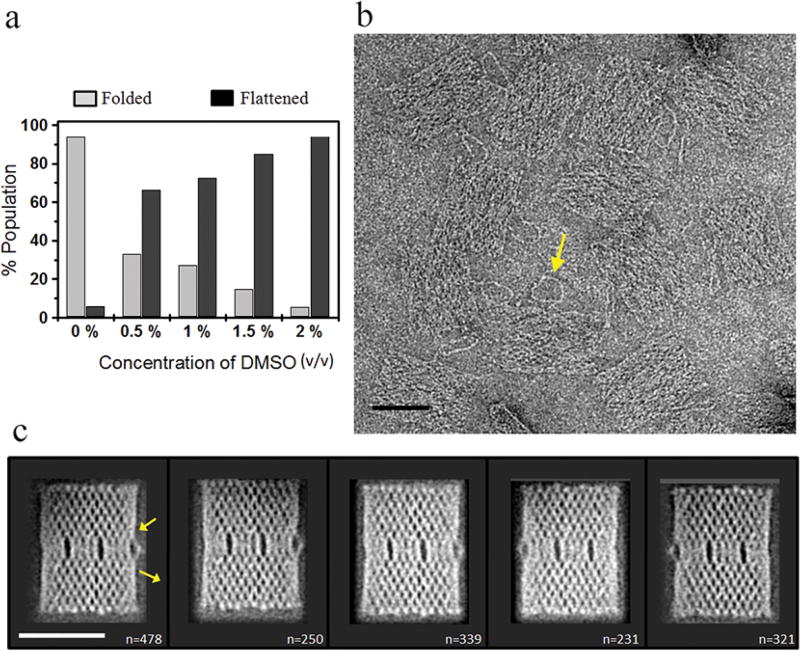
Surface flattening of 2D DNA origami in 2% (v/v) DMSO. (a) Population distribution of origami conformations at 0–2% (v/v) DMSO. A total of ≥350 origami particles from several fields of view were analyzed to generate this plot. (b) Typical EM image of DNA origami in 2% (v/v) DMSO. The arrow highlights a double-stranded DNA marker loop in raw origami images. Scale bar is 50 nm. (c) Representative 2D class averages of negatively stained origami, as shown in (b). Two arrows show the entry and exit points of the double-stranded DNA marker loop. The number of individual origami images contributing in each average is provided in the bottom-right corner of the corresponding image. Scale bar is 50 nm.

