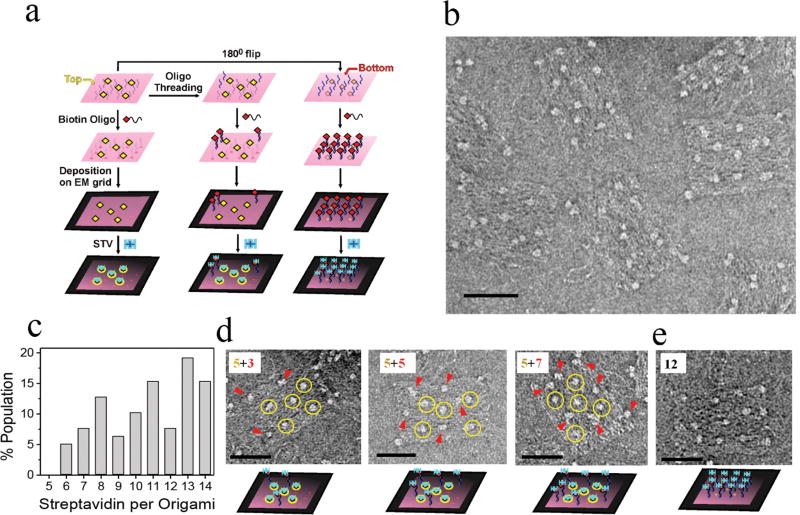
Figure 5.
EM visualization of threading on DNA origami nanoplatforms. (a) Schematic of the experimental strategy and expected results. Yellow and red arrows highlight the biotin- (top) and DNA linker-modified (bottom) faces on the left and right panel, respectively. Similarly, the biotins on the top and bottom faces of the origami are highlighted as yellow and red diamonds, respectively. The middle panel depicts threading of DNA oligonucleotides (blue) from the bottom to the top face. (b) Negative stain image of streptavidin molecules (bright spots) attached to the origami structures via surface biotins and/or biotinylated DNA oligonucleotides. (c) Distribution of streptavidin molecules per DNA origami. A total of 156 individual origami images were analyzed for the distribution histogram. (d) Representative origami images that show evidence of threading. Five streptavidin molecules bound to surface biotins are indicated by yellow circles. The binding of streptavidin to the threaded DNA linkers via prehybridized biotin-modified oligonucleotides is highlighted by red arrows (threading of 3, 5, and 7 DNA linkers are highlighted as “5 + 3”, “5 + 5”, and “5 + 7”, respectively). (e) Streptavidin captured on an origami face with 12 DNA linkers. Bottom row of (d) and (e) shows the most likely arrangement of streptavidin on DNA origami. Scale bars are 50 nm.

