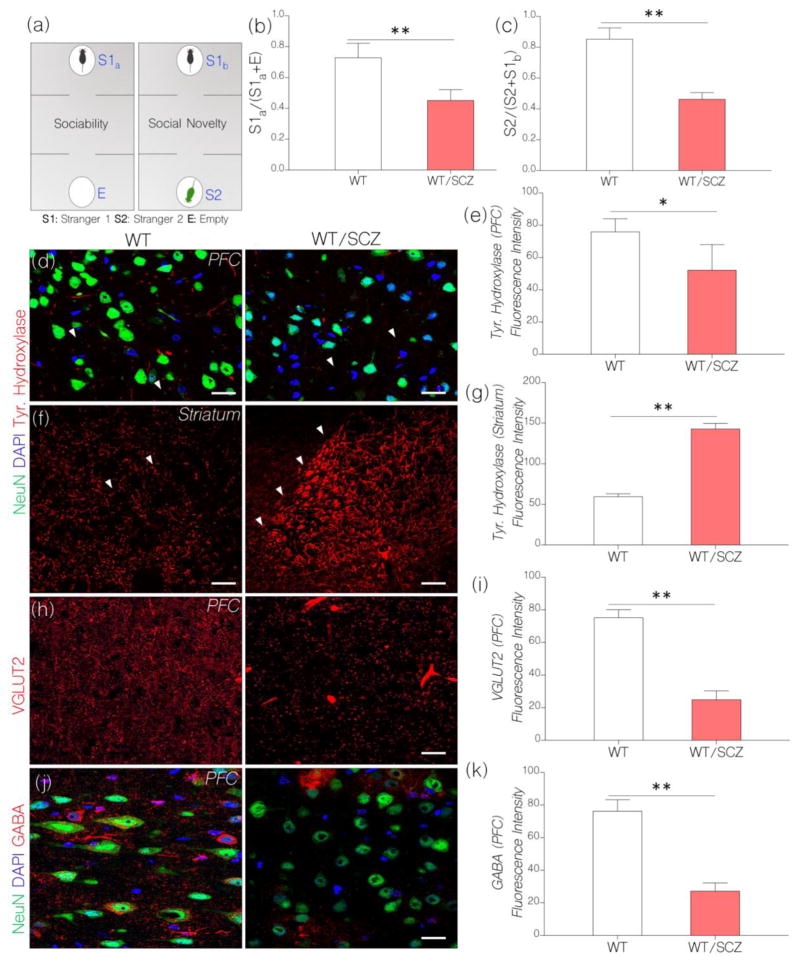
Figure 2.
a, Diagrammatic illustration of the steps involved in the behavioral test paradigm for assessing social behavior after NMDAR hypofunction has been induced in mice. The test involves two separate phases: sociability test and social novelty test.
b, Bar chart depicting sociability test outcome in control and NMDAR hypofunction mice. Induced NMDAR hypofunction caused a decline in sociability behavior in WT mice treated with ketamine (WT/SCZ). WT/SCZ mice showed no preference for stranger 1 (S1a) versus the empty chamber “E” (n=10) when compared with the control (p<0.01).
c, Social Novelty: WT/SCZ mice showed no preference for S2 over S1b (n=10). As such, WT/SCZ group was considered deficient in social novelty when compared with the control (p<0.01).
d, Representative confocal images show a change in cortical tyrosine hydroxylase in behaviorally deficient mice after induced NMDAR hypofunction. Induced NMDAR hypofunction caused a decrease in tyrosine hydroxylase positive terminals in the PFC when compared with the control (p<0.05; scale bar=20μm). Arrow heads indicate tyrosine hydroxylase positive terminals in the PFC.
e, Bar chart depicting statistical comparison for cortical tyrosine hydroxylase expression in WT (control) and NMDAR hypofunction (WT/SCZ) PFC.
f, Representative confocal images show a change in striatal tyrosine hydroxylase expression after induced NMDAR hypofunction. WT/SCZ mice exhibited striatal hyperdopaminergia when compared with the control (p<0.01; scale bar=40μm). Arrow heads highlight the margin of tyrosine hydroxylase fibers within the striatum.
g, Bar chart illustrating the expression of striatal tyrosine hydroxylase for WT and WT/SCZ group.
h, Confocal images show vesicular glutamate transporter (VGLUT2) expression in the cortex. After induced NMDAR hypofunction (WT/SCZ), VGLUT2 expression decreased significantly in the PFC when compared with the control (p<0.01; scale bar=20μm).
i, Bar chart show a reduction in VGLUT2 expression in the PFC of WT/SCZ mice: versus the control.
j, Confocal images show a combined localization of GABA and neuron (NeuN) in the PFC. Cortical GABA expression reduced significantly in mice after an induced NMDAR hypofunction (p<0.01 versus the control). GABA positive neuronal clusters formed enlarged patches around neuronal cell bodies in the PFC of WT/SCZ mice (scale bar=20μm).
k, Bar graph demonstrating statistical comparison for GABA expression in the PFC of control (WT) and WT/SCZ mice.

