Figure 3.
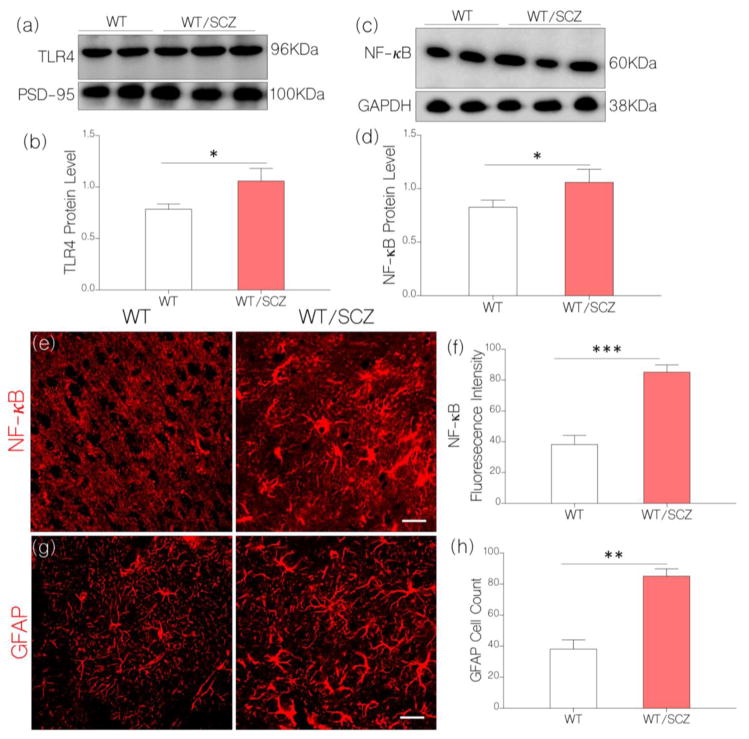
a, Quantitative immunoblots show the expression of TLR4 in brain tissue lysate. The intensity of TLR4 was normalized by the corresponding PSD-95 and GAPDH expression.
b, Bar chart illustrating an increase in normalized neural TLR4 expression for WT/SCZ mice (p<0.05) when compared with the control (WT).
c, Immunoblot show normalized expression of NF-κB in the brain tissue lysate of control (WT) and WT/SCZ mice.
d, Bar chart demonstrating upregulated (normalized) NF-κB expression for WT/SCZ mice when compared with the control (WT; p<0.05).
e, Confocal images (scale bar=20μm) illustrating an increased neural NF-κB expression (normalized fluorescence intensity) for WT/SCZ mice when compared with the control (WT; p<0.001)
f, Statistical comparison of NF-κB fluorescence intensity for WT/Control and WT/SCZ groups.
g, GFAP positive cell count increased per unit area (astrocyte/μm2) in the cortex of WT/SCZ mice when compared with the control (p<0.01; scale bar=20μm).
h, Bar charts illustrating the comparative distribution of GFAP positive cells in the brain of control (WT) and WT/SCZ mice.

