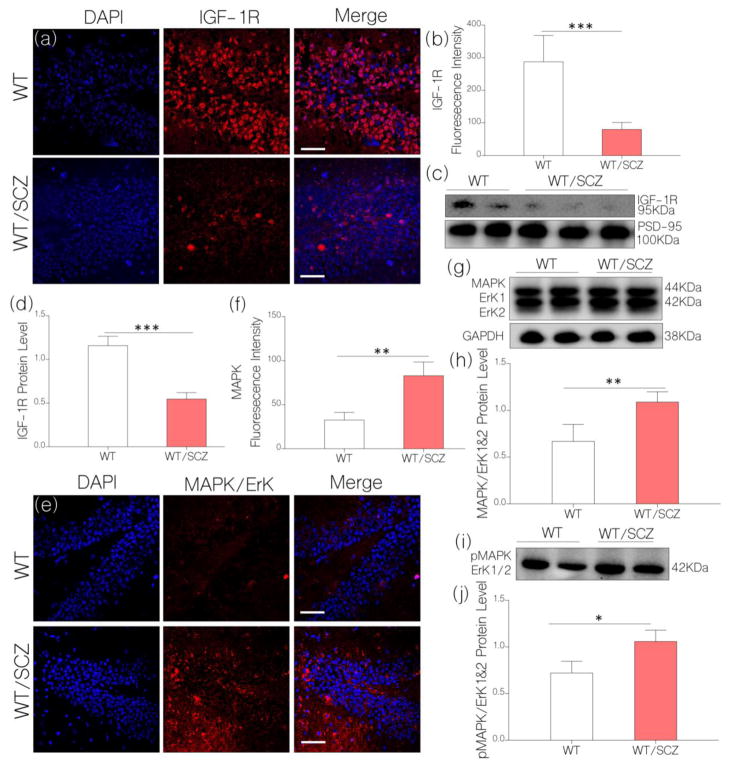
Figure 4.
a, Illustrative confocal images show a decrease in hippocampal IGF-1R expression for WT/SCZ mice (p<0.001) when compared with the control (scale bar=20μm).
b, Bar chart illustrating normalized fluorescence intensity for IGF-1R expression in WT (control) and WT/SCZ hippocampus.
c, Quantitative immunoblots show a significant decrease in neural IGF-1R expression for WT/SCZ mice when compared with the control (WT; p<0.001).
d, Bar chart demonstrating normalized IGF-1R protein level for WT (control) and WT/SCZ brain lysate.
e, Representative confocal images (scale bar=20μm) show an increased MAPK/ErK1/ErK2 expression for WT/SCZ hippocampus when compared with the control (WT; p<0.01).
f, Bar chart illustrating a comparative MAPK/ErK expression for WT and WT/SCZ hippocampus.
g, Quantitative immunoblots show MAPK/ErK1/ErK2 expression in hippocampal lysate of WT and WT/SCZ mice. MAPK/ErK (p<0.01) increased in the hippocampal lysate of WT/SCZ mice when compared with the control (WT).
h, Bar charts depicting statistical change in normalized MAPK/ErK expression in hippocampal lysate of WT (control) and WT/SCZ mice.
i, Western blot demonstrating an increased pMAPK/ErK1/ErK2 expression in hippocampal lysate of WT/SCZ mice when compared with the control (p<0.05).
j, Bar charts depicting statistical change in normalized pMAPK/ErK expression in hippocampal lysate of WT (control) and WT/SCZ mice.

