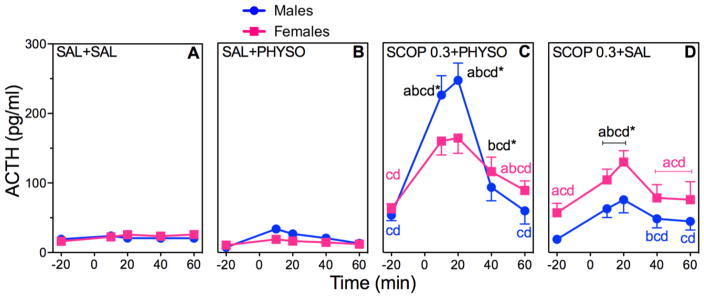
Figure 3. Effects of SCOP Pretreatment on ACTH in PHYSO-Stimulated Male and Female Rats.
Response curves of absolute plasma ACTH (A–D) and corresponding percent changes from baseline (E, F). Baseline blood samples were collected at −25 min and −15 min to yield an average baseline at −20 min. Injection of SCOP (0.3 mg/kg) or SAL (1 ml/kg) occurred immediately after collection of the −25 min blood sample. Injection of either PHYSO (0.1 mg/kg) or SAL (1 ml/kg) occurred at 0 min. Four additional blood samples were collected at 10 min, 20 min, 40 min, and 60 min. Each bar represents the mean ± SEM. n = 23 to 24 rats for SAL + SAL groups; n = 7 to 8 rats for SAL + PHYSO groups; n = 8 to 12 rats for SCOP pretreatment groups. Females are represented by squares and males are represented by circles. a, sex difference at indicated dose and time point (p < 0.05); b, vs. baseline (p < 0.05); c, vs. SAL + SAL at indicated time point (p < 0.05); d, vs. SAL + PHYSO at indicated time point (p < 0.05). * designates that letters apply to both sexes at indicated time point.

