Fig. 1.
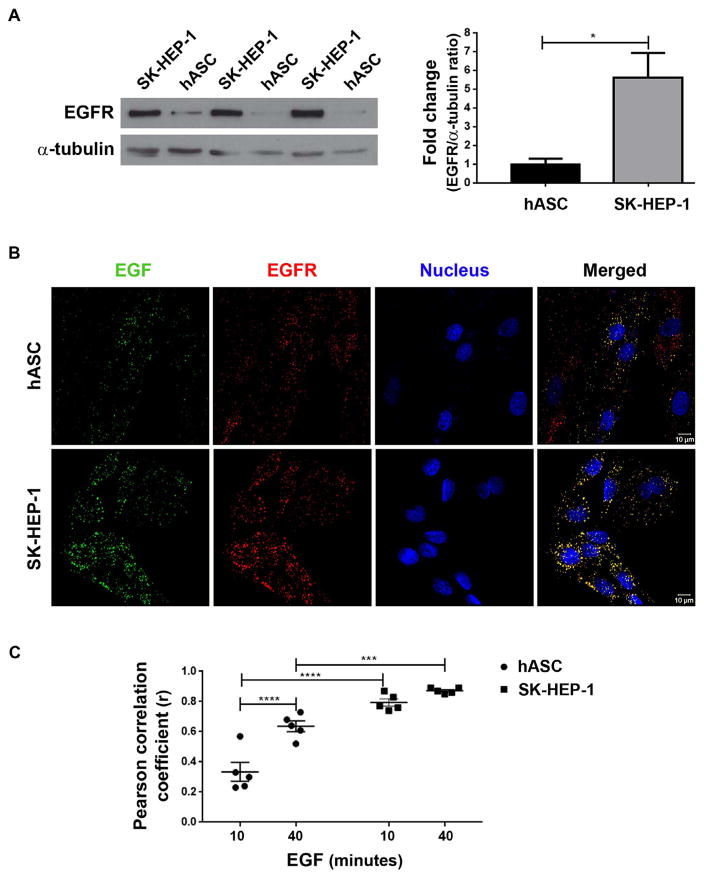
EGFR colocalizes with labeled EGF in both cell types. A- Western blot of proteins extracted from both cell types cultured for 12–16 h in medium without FBS followed by densitometric analysis of the protein bands related to the expression of EGFR (175 kDa). The expression of α-tubulin (50 kDa) was used as a normalizer. Data were expressed as fold change of hASC bands fluorescence intensity. Statistical test: Student’s T test; N = 3 samples; *: p < .05. B- Super-resolution images of hASC and SK-HEP-1 cells stimulated for 40 min with 200 ng/mL of EGF conjugated to Alexa Fluor® 488 (in green). After stimulation, cells were stained for EGFR (in red) and nucleus (in blue). The merged images show the colocalization between EGF and EGFR in yellow. Scale bar: 10 μm. C- Graph showing a Pearson correlation coefficient (r) of colocalization analysis for cells of both types stimulated by 10 and 40 min with EGF. Statistical test: Two-way ANOVA with Bonferroni’s multiple comparisons test; N = 5 images for each group; ***: p < .001; ****: p < .0001. (For interpretation of the references to color in this figure legend, the reader is referred to the web version of this article.)

