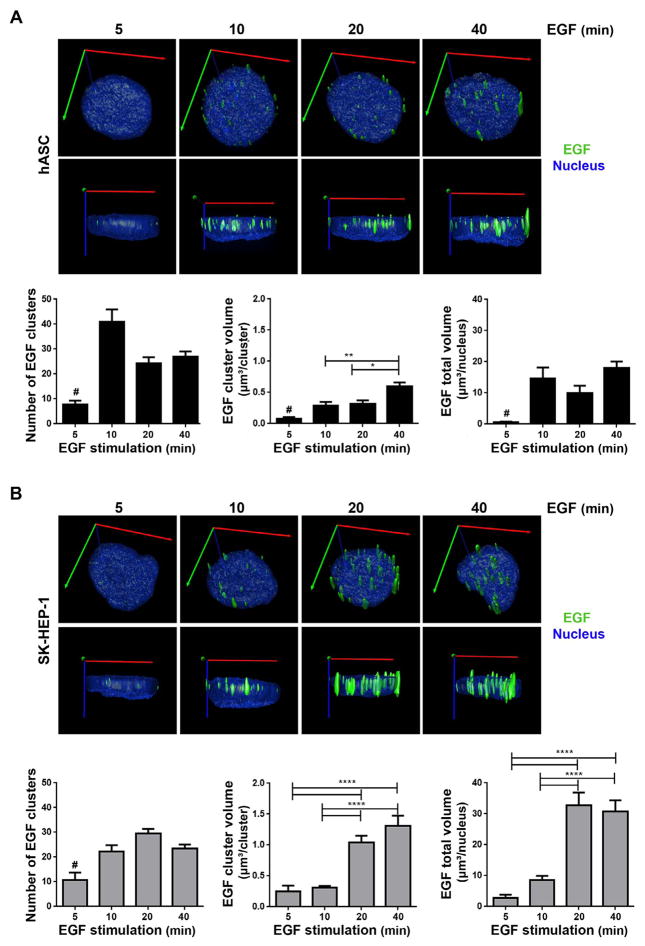
Fig. 3.
Three-dimensional quantification analysis of EGF clusters in hASC (A) and SK-HEP-1 (B). A and B: top images - Super-resolution microscopy images of cells stimulated by 5, 10, 20 and 40 min with EGF complexed to Alexa Fluor® 488 were used to create a rendered surface of the nucleus (blue) and EGF clusters (green) in three dimensions. Axes represented in the images: X (red), Y (green) and Z (blue). A and B: bottom images- The number of EGF clusters in each cell, the mean volume of each cluster and the total volume occupied by EGF clusters in each cell nuclei were analyzed. Statistical test: Kruskal-Wallis with Dunn post-test. Bars: mean ± standard error; #: Differs from all other groups with p < .05; *: p < .05; **: p < .01; ****: p < .0001. N = hASC: 28 (5 min), 40 (10 min), 38 (20 min), 41 (40 min); SK-HEP-1: 21 (5 min), 37 (10 min), 34 (20 min), 37 (40 min). (For interpretation of the references to color in this figure legend, the reader is referred to the web version of this article.)

