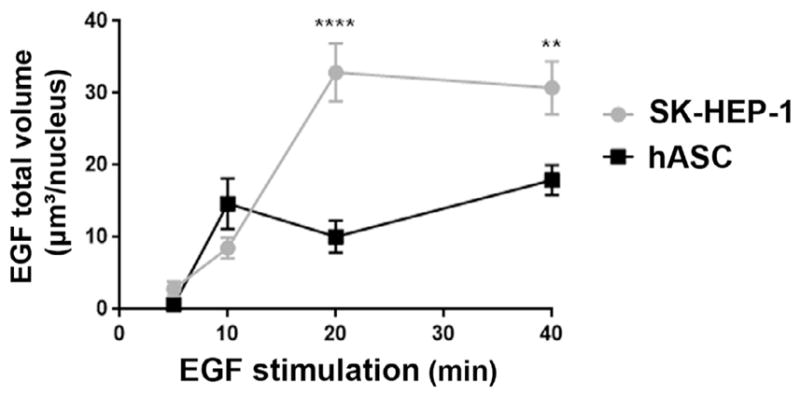
Fig. 4.

Profile of EGF translocation kinetics to the nucleus differs between hASC and SK-HEP-1. Cells of both cell types were stimulated by 5, 10, 20 and 40 min with EGF complexed to Alexa Fluor® 488. The graphic represents the mean ± standard error of volume occupied in the nucleus by the EGF clusters in each cell. **: p < .01; ****: p < .0001. Statistical test: Two-way ANOVA with Bonferroni’s multiple comparisons test; N = hASC: 28 (5 min), 40 (10 min), 38 (20 min), 41 (40 min); SK-HEP-1: 21 (5 min), 37 (10 min), 34 (20 min), 37 (40 min).
