
Fig. 4.
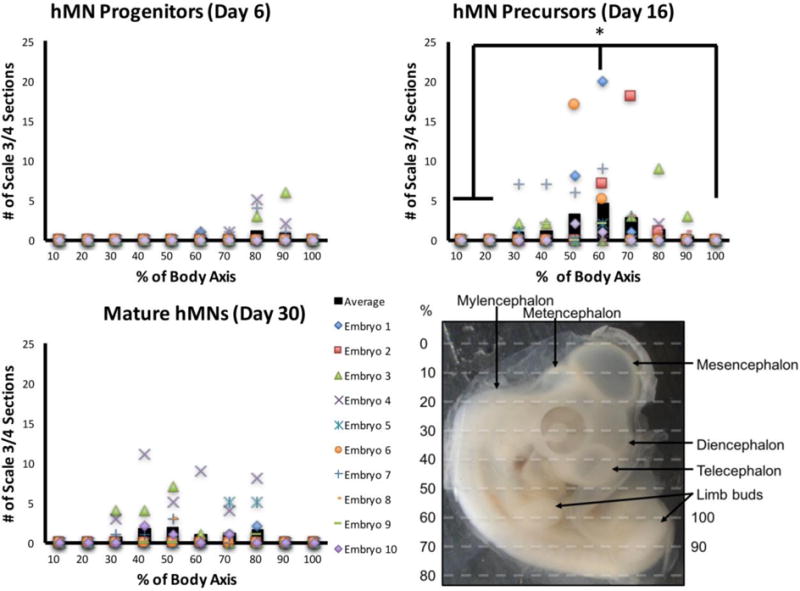
Quantitative analysis of hMN engraftment. Rostrocaudal body axis of chick embryo was subdivided into 10 domains (bottom right image). Each graph shows the number of tissue sections per domain per embryo that displayed Scale 3 or 4 engraftment of GFP+ hMNs. Black bars indicate the average across all 10 embryos, and symbols represent data points for each embryo. Only HB9+(GFP+)/ChAT− hMN precursors showed enhanced engraftment at ~60% of rostrocaudal axis corresponding to the cervical wing bud (n=10 embryos). * indicates p≤0.05 using a Wilcoxon Rank Sum Test with a post-hoc Benjamini-Hochberg procedure.