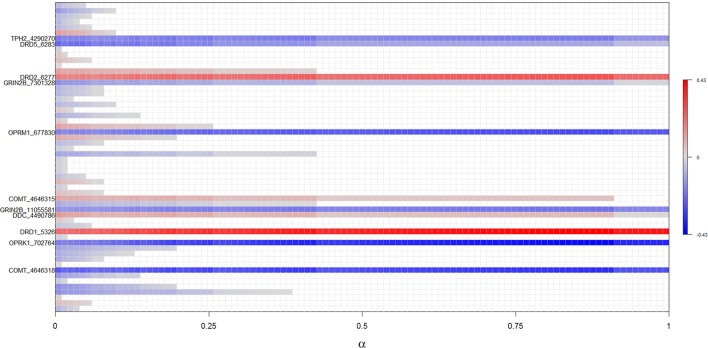
Figure 1.
Results of regularized regression with elastic net penalization for α-values between 0 and 1. Polymorphisms positively associated with ICDs (i.e., increases risk) are highlighted with red, while polymorphisms negatively associated with ICDs (i.e., decreases risk) are highlighted in blue, with the intensity of color reflecting the strength of association. Polymorphisms not associated with ICDs are white. Identified polymorphisms demonstrate significant association across all levels of α.

