
Figure 2.
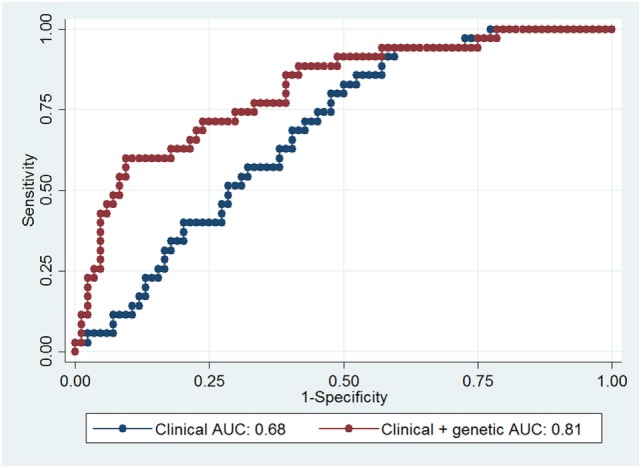
Receiver-operating characteristic (ROC) curves for prediction of impulse control disorders (ICDs). The blue curve was plotted with clinical variables (age and dopamine agonist use), while the red curve was plotted with clinical and the four candidate single-nucleotide polymorphisms. Area under the curve (AUC) for each model is indicated in the figure.