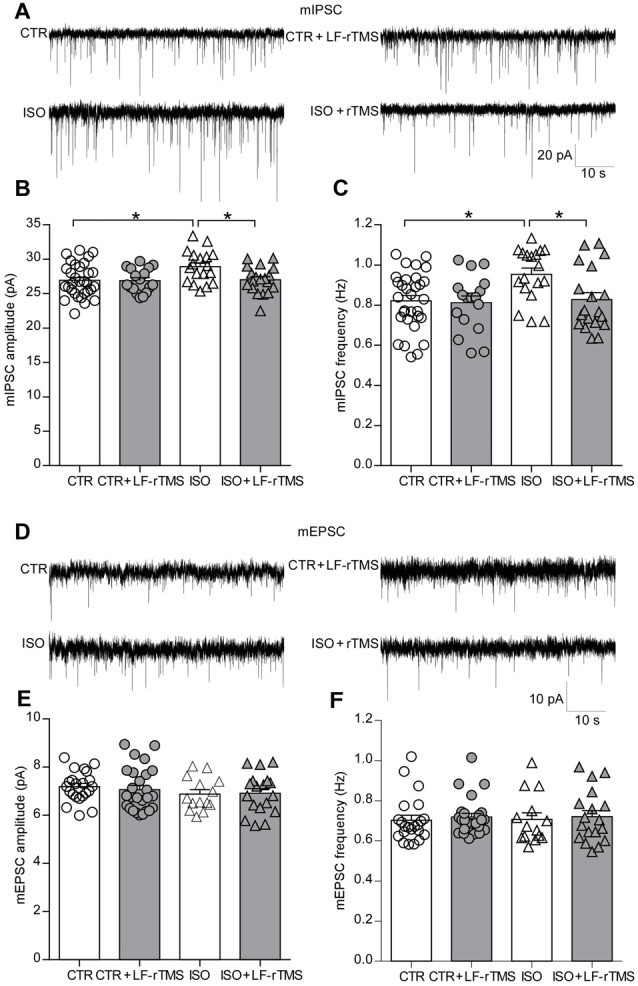
Figure 4.

LF-rTMS readjusts the balance between the excitatory and inhibitory synaptic activity of hippocampal pyramidal neurons in neonatally isolated rats. (A) Representative miniature inhibitory postsynaptic currents (mIPSCs) traces. Bar graphs of the mIPSC amplitude (B) and frequency (C). (D) Representative miniature excitatory postsynaptic currents (mEPSCs) traces. Bar graphs of the mEPSC amplitude (E) and frequency (F). Cells in each group are 14–31. Rats used are n = 5–8 per group. All data shown are represented as mean ± SEM (*P < 0.05, two-way ANOVA and Tukey’s post hoc test).
