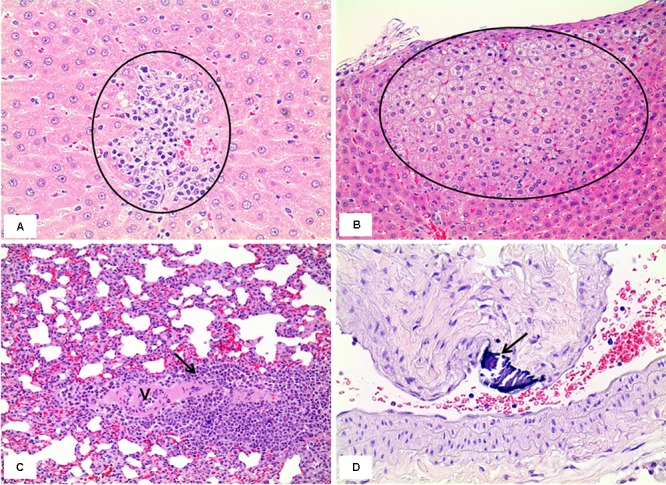
FIGURE 12.

Histopathology of livers and lungs in the male rats exposed by inhalation of the mixture of SM and PG for 2 weeks in the recovery study. The results represent focal mononuclear cell infiltration (circle in A, the control group) and tension lipidosis (circle in B, the medium group) in the liver and perivascular mononuclear cell infiltration (arrow in C, the vehicle control group) and vascular mineralization (arrow in D, the low group) in the lungs. H&E staining. Magnification = ×400 for A, ×200 for B, C, and D.
