Figure 3.
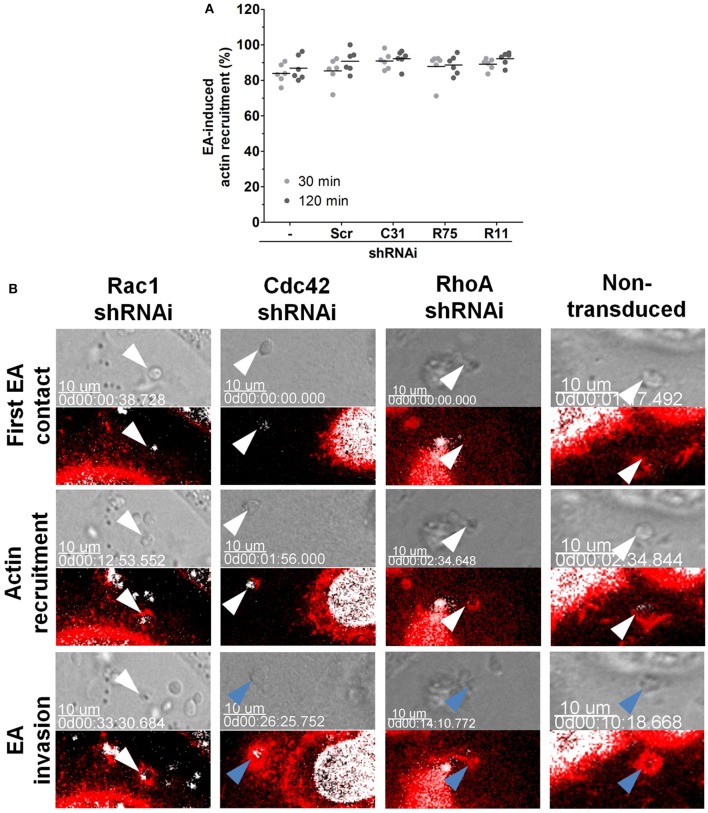
Depletion of Rac1 delays EA internalization. (A) Depleted HeLa lineages incubated with EA for the indicated times points were fixed and stained for filamentous actin, and the proportion of EA-induced actin recruitment was quantified by epifluorescence microscopy. Approximately 80% of interacting EAs induced actin recruitment in cells depleted of Cdc42, Rac1 or RhoA (C31, R75 or R11, respectively) and in the control [scramble (Scr) and non-transduced (-)] cell lineages at 30 or 120 min of interaction. Results represent mean of two independent experiments in triplicate, and each dot represents a replicate (One-Way ANOVA, no statistical differences, n ≥ 6). (B) EA-induced actin recruitment and internalization were assessed in the indicated depleted lineages by live time-lapse confocal microscopy. In Rac1 depleted cells (left panel), EA (white arrowheads) attaches and induces actin polymerization but fails to invade even after 30 min of initial contact. In contrast, in the non-transduced control group (right panel) and in the Cdc42 or RhoA depleted HeLa cells (central panels), EAs (white arrowheads) attach, induce actin (red) polymerization and successfully invade (blue arrowhead) host cells a few minutes after their first contact. LifeAct-RFP (red) plasmid transfection was used to track filamentous actin, and Hoechst (white) was used to stain nuclei and kinetoplasts. Corresponding DIC images of single focal planes and merged fluorescence channels were acquired with approximately 2-min time intervals. These are representative observations from at least 50 interactions of 2 independent experiments.

