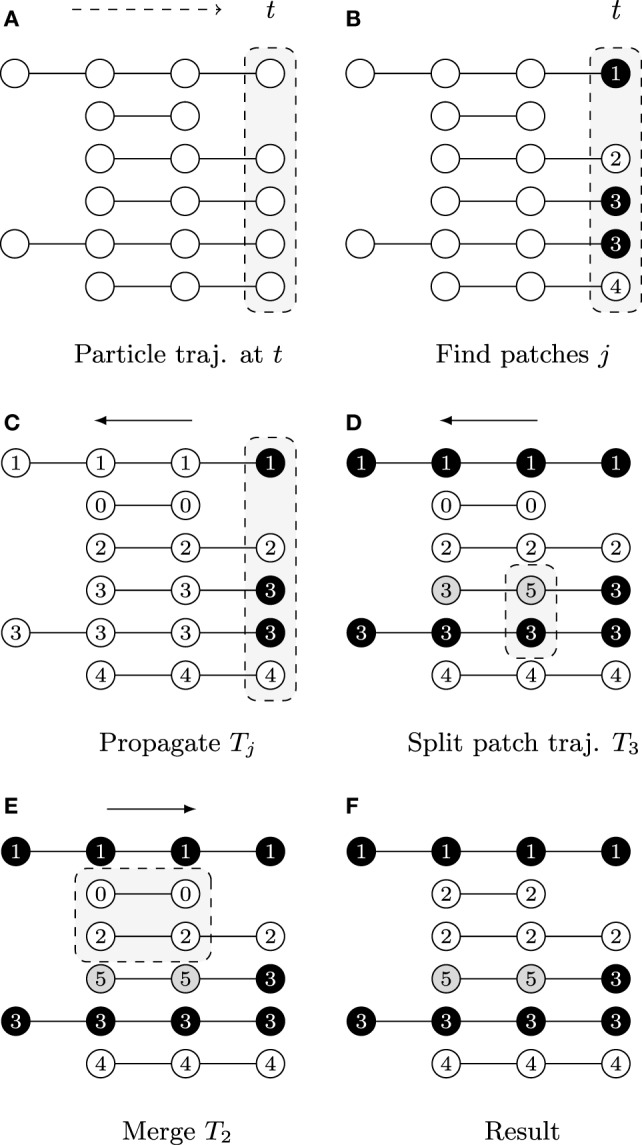
Figure 3.

A graphical description illustrating the patch lineage construction algorithm, where each row shows a temporally coherent particle trajectory that is close to those above and below it in feature space. The dots represent particle positions at each time point and their coloring of white/gray/black represents differences found in feature space provided the user-specified thresholds. The slice of space-time that is the focus of computation in each subfigure is highlighted by gray boxes with dashed outlines. (A) Biomovies have a naturally occurring temporal direction, represented as a dashed arrow ending at time t. The trajectories have a different number of particles, showing that particles can appear at any time point. (B) Particle trajectories are grouped into patches at the last time point. (C) The trajectory information is propagated upstream in a run from the last to the first time point. (D) The split propagation proceeds from the last to the first time point. (E) The merge propagation runs from first to the last time point, mirroring biological growth. (F) The resulting patch lineage contains 5 patches.
