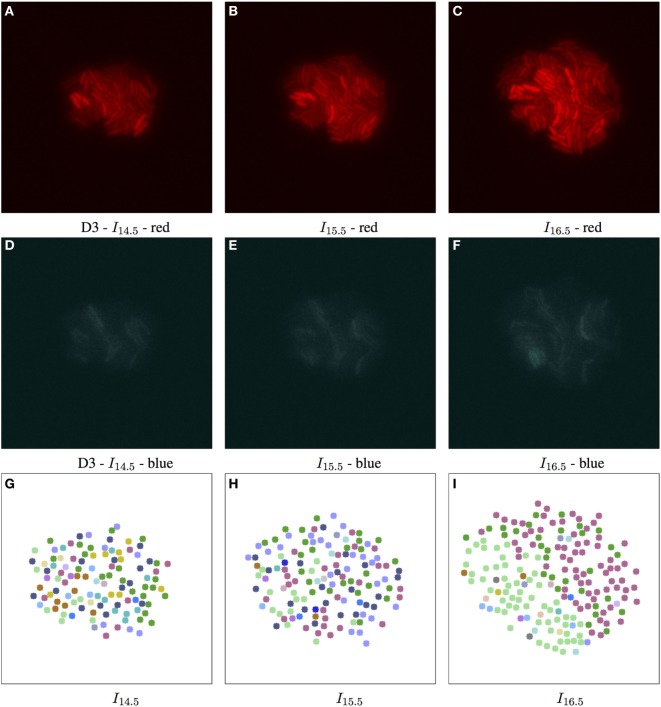
Figure 6.
Biomovie D3 with RGB channels of image points 14.5, 15.5, and 16.5 h, and their corresponding patch structure, respectively. Enhanced exposures for red: 60% and blue: 90%. The S. meliloti bacterial cells are bio-engineered to fluoresce in a particular way, where each channel encodes a certain trait, or behavior. The red (A–C) and blue channels (D–F) show certain behavior in response to changes of conditions; here the bacterial cells are of wild type, and exposed to high concentrations of phosphate, influencing bacterial communication. The green channel is omitted due to its homogenous fluorescence. The patch structure is found using the following thresholds: geometric distance 100 px, and specific channel differences of red: 20, green: 50, and blue: 50. Main images show 7-px dots at computed particle locations. (G–I) The split/merge computation has been run, and particles are colored by their patch ID.

