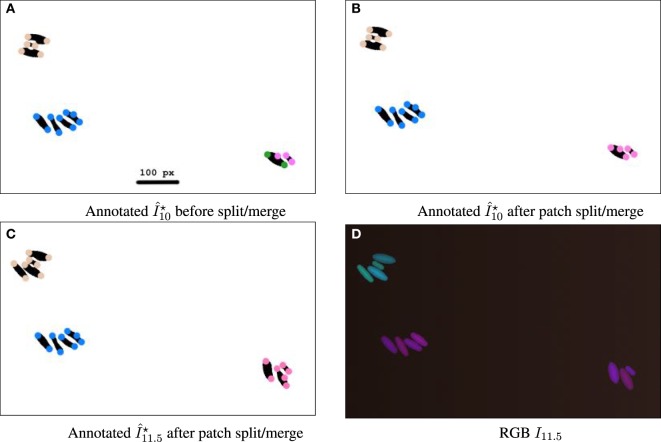
Figure 8.
Sequence illustrating the split/merge computation with simulated movie DS5, designed to allow patches to be verifiable by the naked eye from the RGB image. Simulated movie DS5 is available from the study by Wiesmann et al. (2017). Images are cropped to a 787 × 482 px subset. (A–C) Binary images are annotated with colored circles, 16 px wide. The color encodes the patch ID. The geometric distance threshold for patch construction is set stringently to 100 px. (A) At time 10 h, before split/merge computation, showing four current patches. The bottom right quadrant has two neighboring cells with differently colored particles showing current assignments to different patches. (B) After split/merge computation, the particles are indeed the same color, showing that the patches have been merged as the patches are within the threshold distance to each other and have similar fluorescence. (C) At time 11.5 h, both the top left patch and the bottom right patch have new cells, and after the split/merge procedure is run for this time point they have correctly been assigned to the correct patch. (D) RGB image at time 11.5 h.

