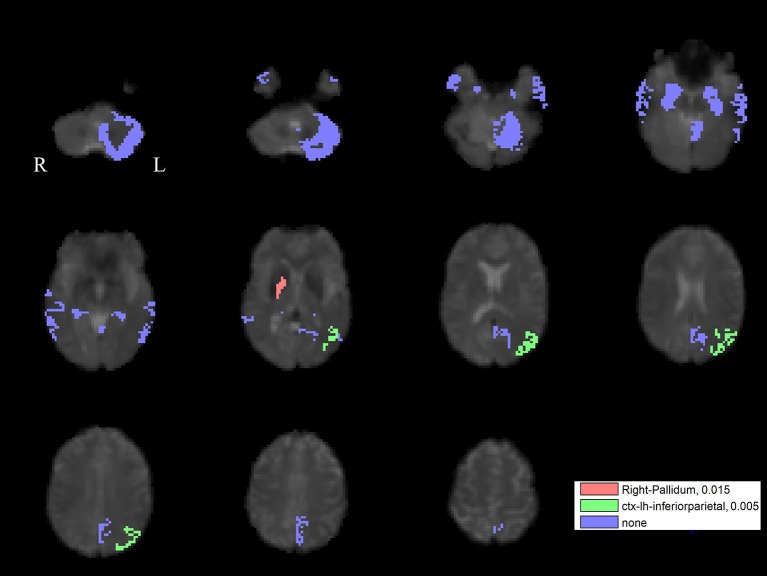
Figure 6.
The GVS impact on the connectivity between the left PPN and PLS-derived regions in the PD group. The red areas represent the regions significantly affected by noisy GVS. The green areas represent the regions significantly affected by sinusoidal GVS. The blue areas represent the regions with no significant changes. The corresponding ROI names and significance values are labeled in the figure.

