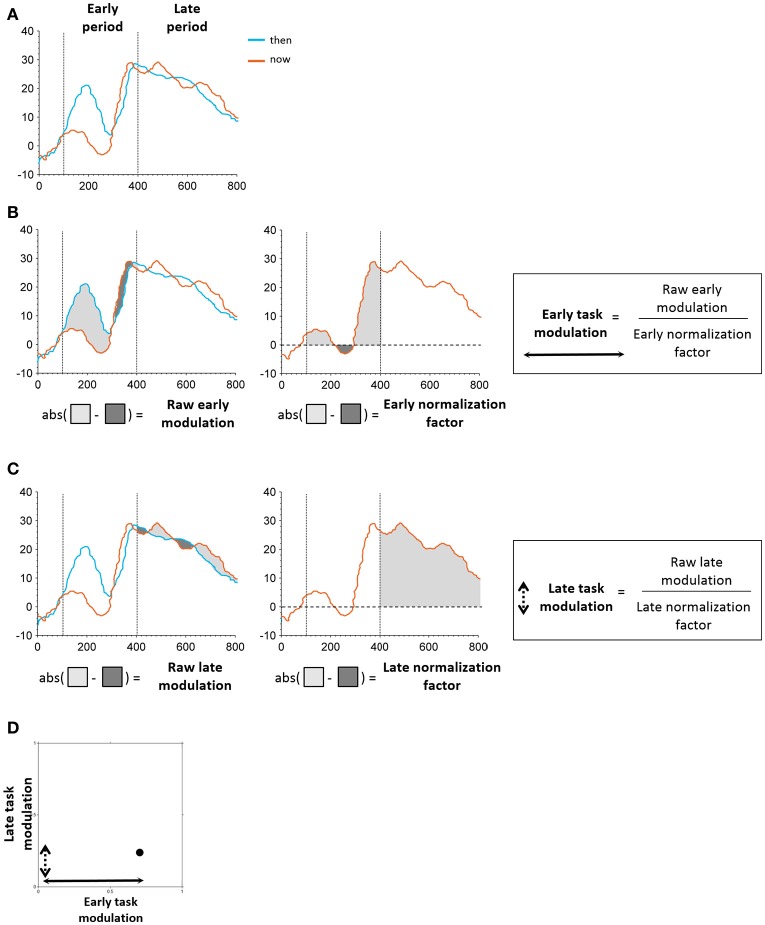
Figure 4.
Schematic illustration of task modulation extraction. (A) Early and late periods identified in the time windows of 100–400 and 400–800 ms post stimulus onset, respectively. (B) Extraction of early modulation value. The raw modulation was defined as the absolute value of the sum of differences between iEPs in the two conditions (“then”-“now,” “there”-“here”; left). The normalization factor was defined as the area under the curve of the “now”/“here” condition in the respective period (middle). The raw modulation was subsequently normalized by the normalization factor of the respective period, resulting in the final task modulation value (right). (C) Extraction of early modulation value. Same procedure as applied for the early task modulation was used here. (D) Each electrode's position in the two-dimensional feature space was determined by its early and late task modulation values.

