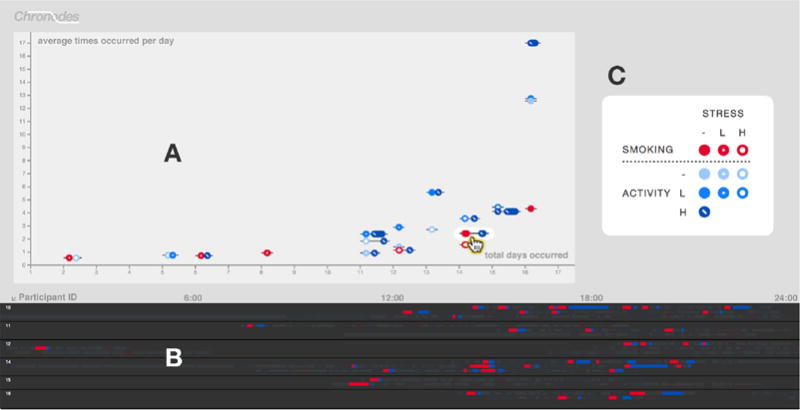
Fig. 2.

The Chronodes Sequence Stage showing a scatterplot of frequent sequences (A) and the Event Orchestra below it displaying the participant event data from which these sequences were mined (B). Whereas all sequences in the Event Orchestra are grayed out by default, when the user mouses over a frequent sequence on the Sequence Stage, its location throughout the participant data is highlighted in the Event Orchestra. (C) The legend for this pilot dataset is magnified here for better readability.
