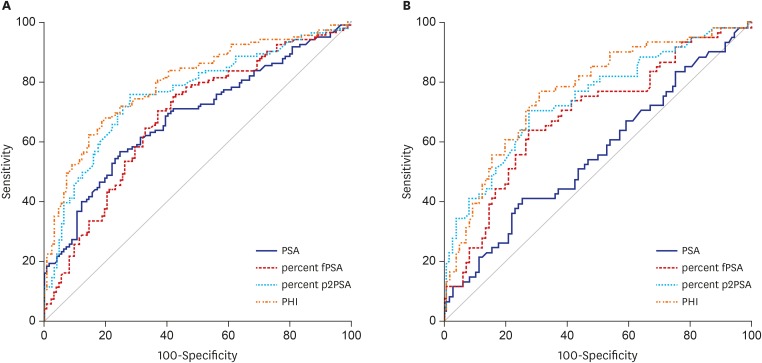
Fig. 1.
ROC curves of the prediction accuracy of PSA, %fPSA, %p2PSA, and PHI for prostate cancer at initial biopsy. (A) ROC curves in all subjects. (B) ROC curves in subjects with tPSA 3.5–10 ng/mL.
ROC = receiver operating characteristic, PSA = prostate-specific antigen, fPSA = free PSA, p2PSA = [-2]proPSA, PHI = prostate health index, tPSA = total PSA.

