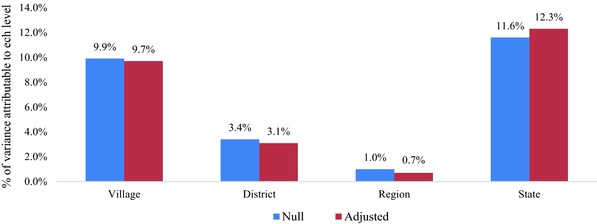
Figure 4d.

Percentage Variation in Per‐Capita Noninstitutional Household Health Spending (PNHS) Attributable to Village, District, Regional, and State Levels in Null and Adjusteda Models, India, 2011‐2012
aAdjusted for age of head of household, sex of head of household (male/female), household size, type of residency (rural/urban), log of annual MPCE (quintiles), dwelling unit (owned/any other), household landholding (no land/up to 1 hectare/up to 2 hectares/more than 2 hectares), source of energy for cooking (LPG, gas, electric, cooking/other), source of energy for lighting (electric, gas/other), marital status of head of household (currently married/other), educational level of head of household (illiterate/primary/middle/secondary/higher secondary), number of adults older than 65 in household, caste (scheduled tribes/scheduled castes/other backward classes/others), religion (Hinduism/Islam/Christianity/other). [Color figure can be viewed at wileyonlinelibrary.com]
