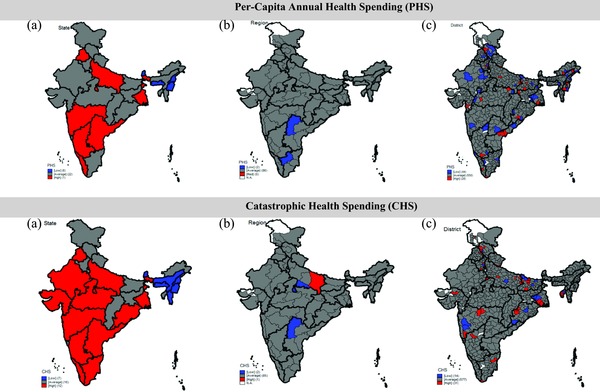
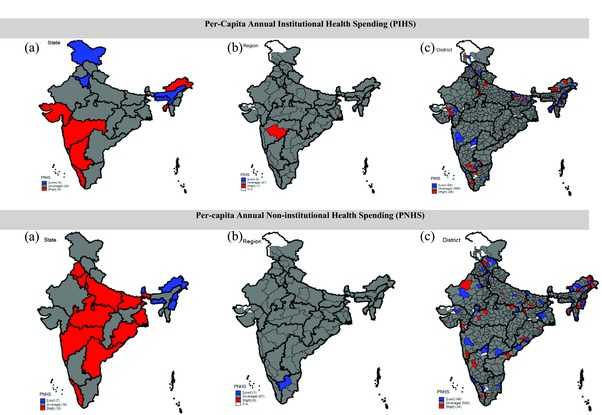
Figure 5.
Maps of India Showing the Geographic Distribution of Low, Average, and High Health Spending of (a) States, (b) Regions, and (c) Districts from the 5‐Level Model (State, Level 5; Region, Level 4; District, Level 3; Village, Level 2; Household, Level 1), 2011‐2012


