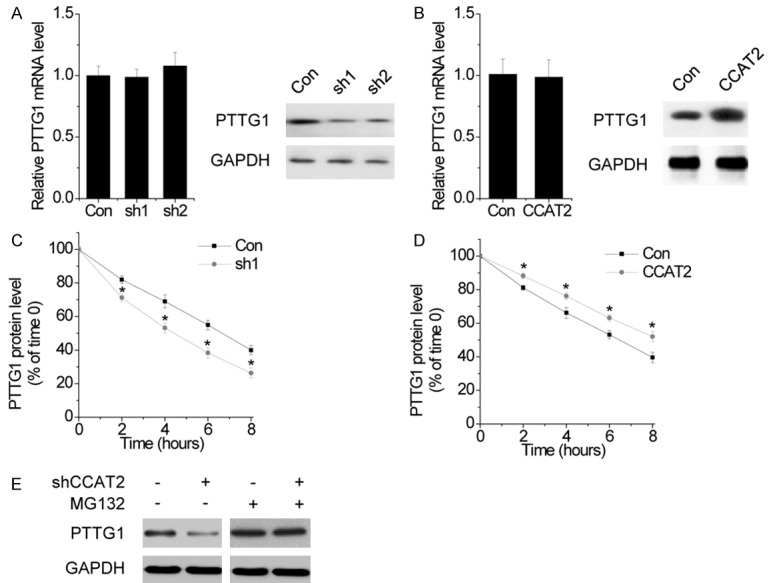
Figure 6.

CCAT2 suppresses the degradation of PTTG1. A. The effect of CCAT2 knockdown on PTTG1 mRNA (left) and protein (right) level was determined by RT-PCR and western blot, respectively. B. The effect of CCAT2 overexpression on PTTG1 mRNA (left) and protein (right) level was determined by RT-PCR and western blot, respectively. C. Quantification of PTTG1 protein levels in control and CCAT2 knockdown cells treated with CHX. D. Quantification of PTTG1 protein levels of PTTG1 in control and CCAT2 overexpressing cells treated with CHX. E. Western blot of PTTG1 expression in control and CCAT2 knockdown cells treated with vehicle control or MG132. Error bars indicate mean ± standard errors of the mean. *P < 0.05.
