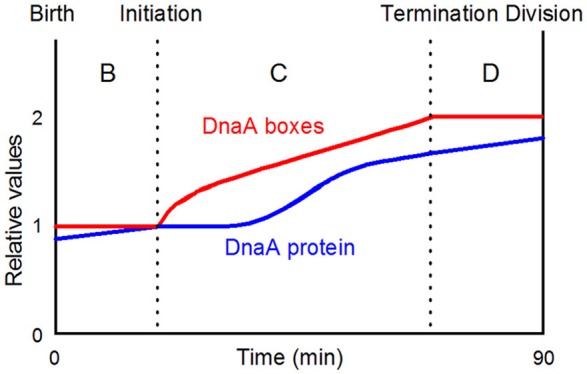
Figure 8.

A simplistic view of when initiation takes place in the cell cycle of slowly growing bacteria. The DnaA protein curve is drawn on the basis of the data presented by Theisen et al. (1993). DnaA-boxes with any distribution will be doubled during the C-period; the actual distribution of all consensus DnaA-boxes and selected groups of consensus boxes are presented in Figure 10; the figure is redrawn from Figure 2A in Herrick et al. (1996, Copyright, John Wiley and Sons).
