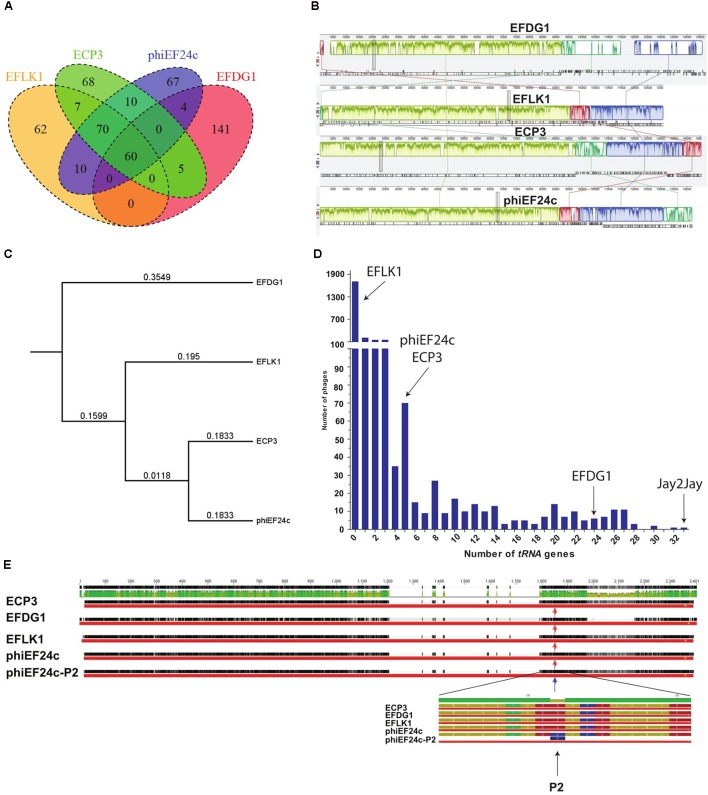
FIGURE 6.
Genomic analysis. (A) Venn diagram represents the number of similar tRNA between EFLK1, ECP3, phiEF24c, and EFDG1 phages (from left to right). (B) Comparative analysis of the genomes of EFDG1, EFLK1, ECP3, and phiEF24c phages (top to bottom). (C) Phylogenetic analysis depicting the similarity between the genomes of the four known phages of E. faecalis. (D) The number of tRNA genes present in the genomes of almost all known phages of E. faecalis V583 is shown here. With EFLK1 phage (E) P2 site mutation is known to be linked to enhanced adsorption as shown by Uchiyama et al., 2011. No differences were found in the P2 mutation site in all the cases.

