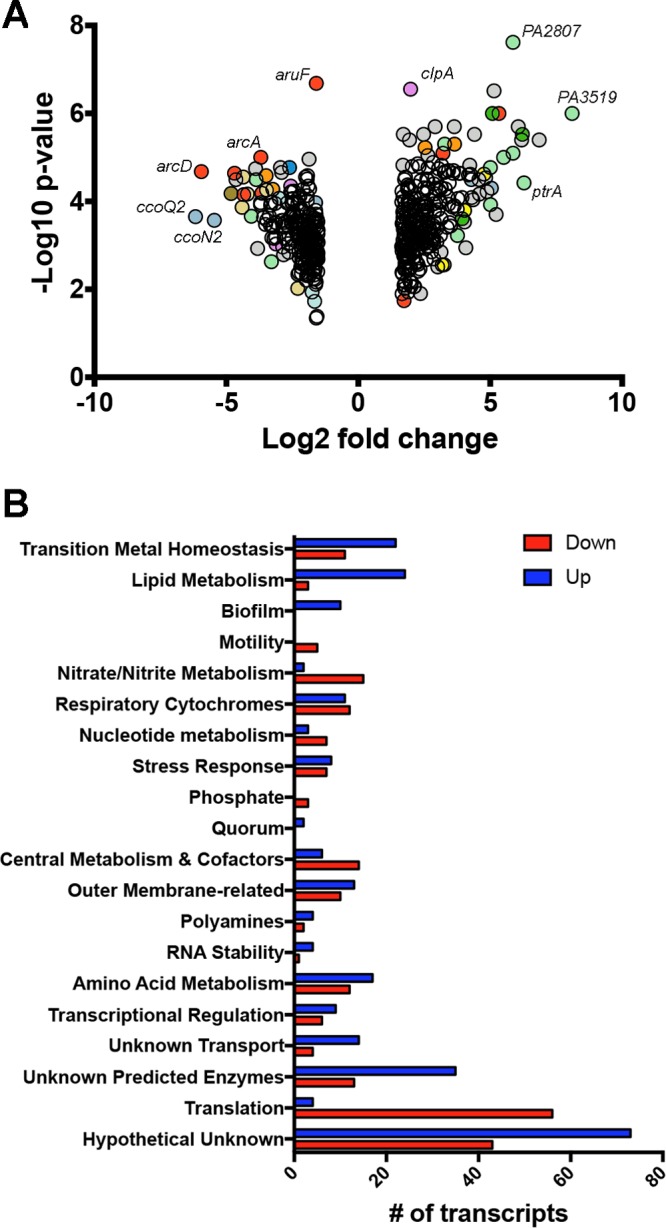
FIG 1.

Pseudomonas aeruginosa transcriptome changes in response to tap water. (A) Volcano plot showing the transcripts that met both fold and P value cutoffs. Colors denote functional classes of transcripts, and only transcripts with two or fewer symbol overlaps are colored: light green, transition metal homeostasis; yellow, lipid metabolism; mauve, stress responses; red, amino acid metabolism; light blue, respiratory cytochromes; gray, hypothetical unknowns. (B) Transcripts plotted in panel A clustered by function showing number of transcripts that were present at higher levels in tap water (blue bars) or lower in tap water (red bars).
