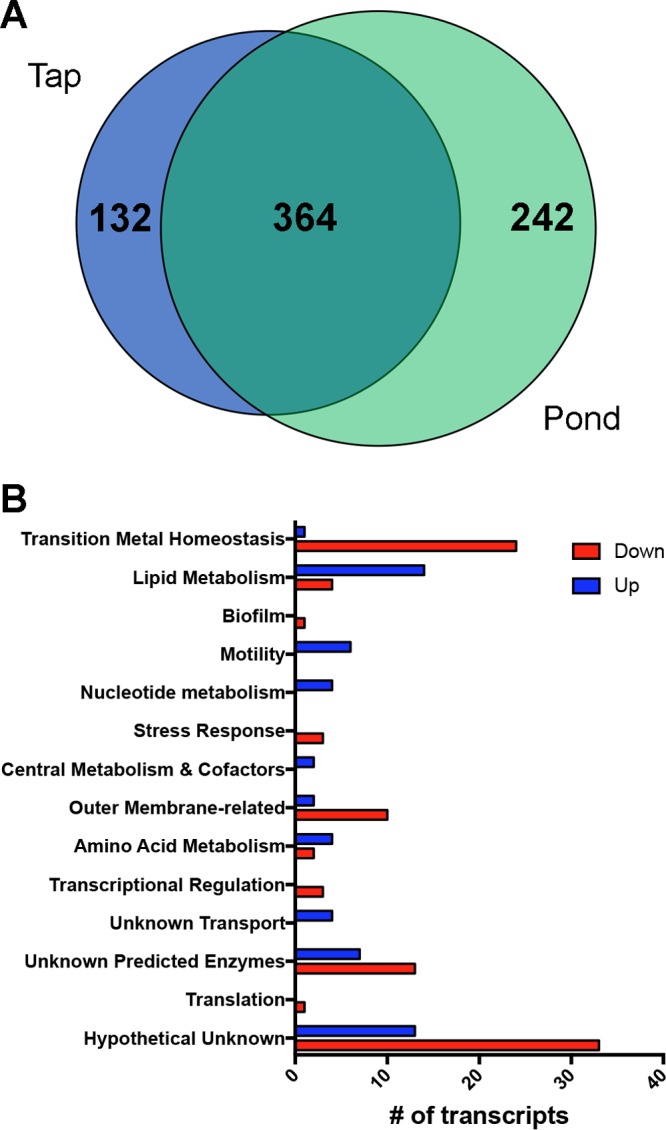
FIG 2.

Pseudomonas aeruginosa transcriptome changes comparing a freshwater pond to tap water. (A) Venn diagram showing the similarity of transcriptome changes in tap water or pond water each compared to 1/2R2B media. Numbers represent number of transcripts. (B) Transcripts that were changed comparing freshwater to tap water clustered by function showing number of transcripts that were higher in pond water (blue bars) or lower in pond water (red bars).
