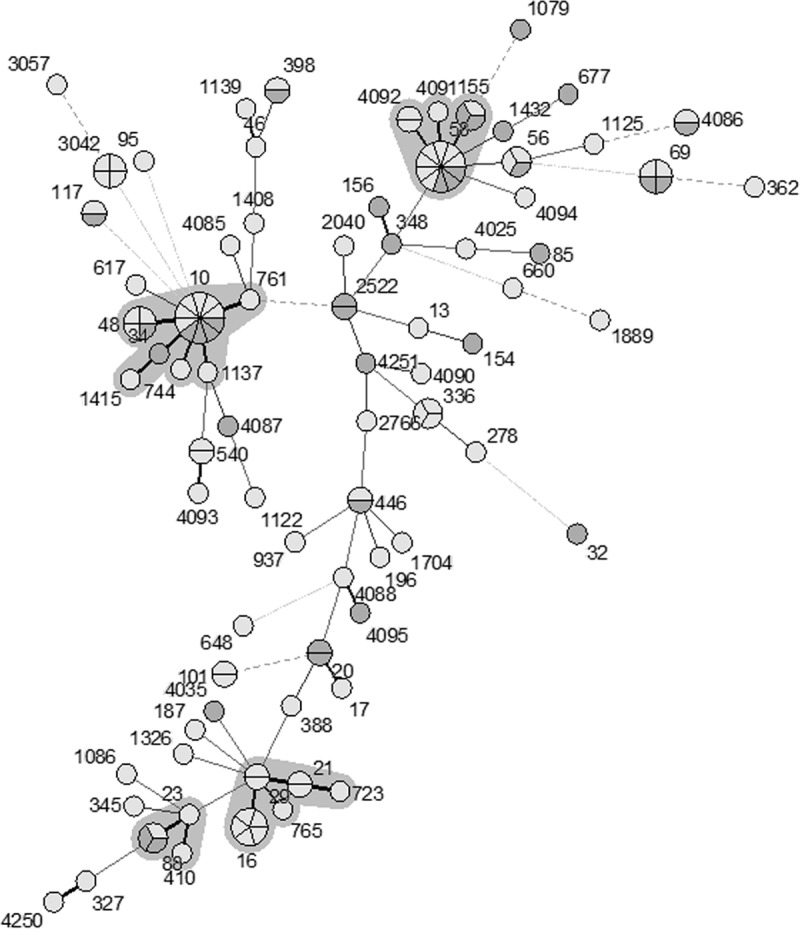
FIG 2.

Minimum spanning tree analysis of 126 blaCTX-M-negative Escherichia coli isolates based on MLST genotypes. Each circle or node represents a genotype, and the partitions within a node are individual isolates. Each clonal complex is surrounded by a gray zone. Thick lines connect genotypes that differ by one locus, and thin lines connect genotypes that differ by two or more loci. Shading indicates the region from which isolates were obtained: pale gray indicates eastern Washington (n = 78) and dark gray indicates northwestern Washington (n = 48).
