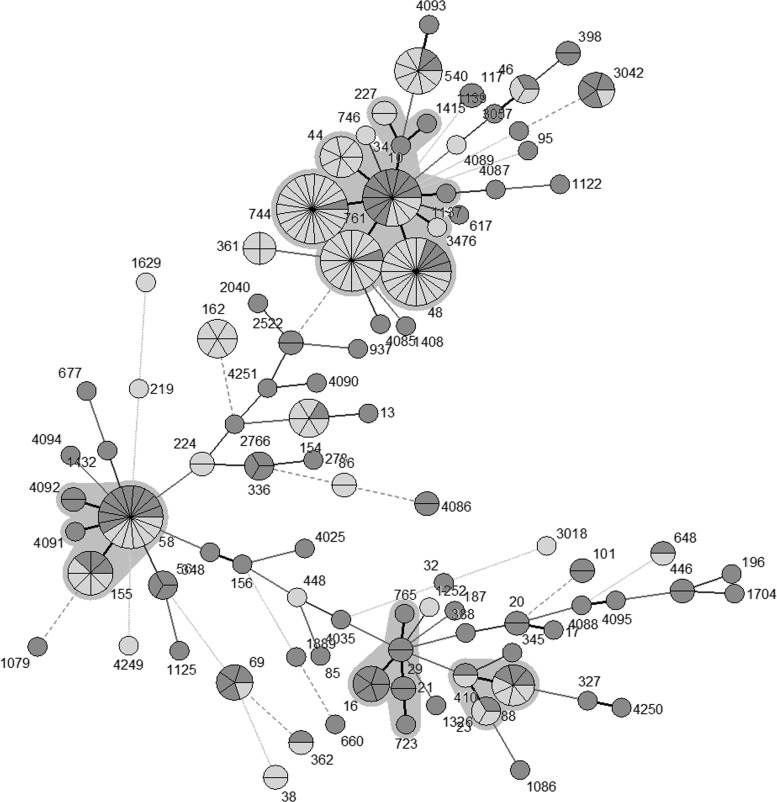
FIG 3.
Minimum spanning tree analysis of 252 Escherichia coli isolates based on MLST genotypes. Each circle represents a sequence type, and the partitions within each circle represent individual isolates. Clonal complexes are surrounded by gray zones. Within each circle, dark gray represents blaCTX-M-positive Escherichia coli isolates (n = 126) and light gray represents blaCTX-M-negative Escherichia coli isolates (n = 126).

