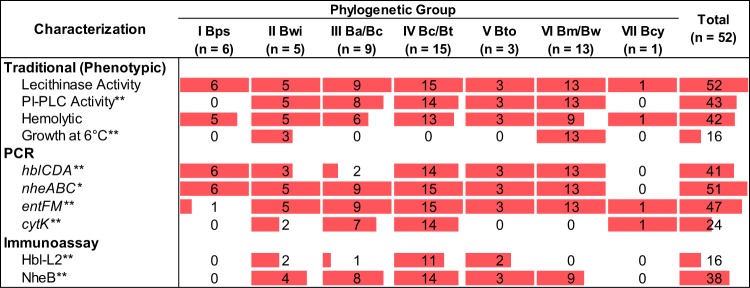
FIG 2.
Variability in phenotypic and molecular characteristics among isolates in different B. cereus clades. Shown is a summary of the number of isolates positive for a given phenotypic or molecular characteristic by clade. The proportion of each cell that is shaded in red corresponds to the proportion of the isolates within a given clade which were positive for the phenotype (i.e., a fully shaded cell corresponds to all isolates being positive for that phenotype). Isolates were classified as PCR positive for gene operons if at least one gene in a given operon was detected by PCR. Asterisks correspond to P values obtained from Fisher's exact tests to assess differences in proportions of isolates positive for a given characteristic in a specific phylogenetic clade compared to isolates positive for the characteristic among all of the other clades combined. **, P < 0.001; *, P < 0.05. Bps, B. pseudomycoides; Bwi, B. wiedmannii; Ba/Bc, B. anthracis/B. cereus sensu lato; Bc/Bt, B. cereus sensu stricto/B. thuringiensis; Bto, B. toyonensis; Bm/Bw, B. mycoides/B. weihenstephanensis; Bcy, B. cytotoxicus.

