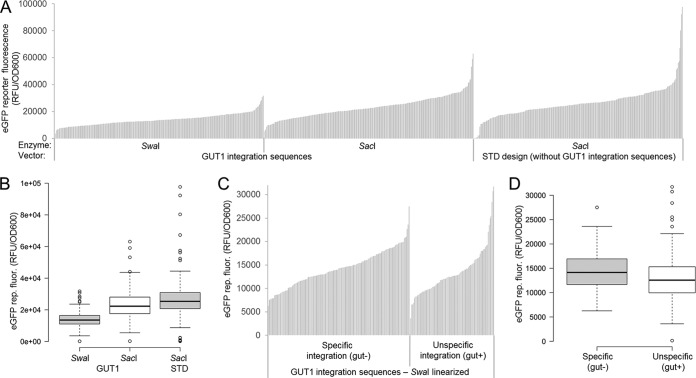
FIG 2.
Screening of 755 P. pastoris transformants indicates that plasmid design, vector linearization, and the type of integration event (specific/nonspecific) mostly influences the expression range of outliers but not the population distribution. (A) Vectors providing GUT1 integration sequences and a standard vector design were linearized with SwaI and/or SacI targeting the integration events depicted in Fig. 1. Cells were pregrown on glucose for 60 h and subsequently induced with methanol for 48 h. eGFP reporter fluorescence normalized to cell growth (OD600) is shown. Results of landscapes typical for work with P. pastoris (40–43) are shown. Each bar represents a transformant (n = 252, 252, and 251 sample points). (B) The data from panel A are shown as a boxplot (59). Center lines show the medians, and box limits indicate the 25th and 75th percentiles as determined by R software. Whiskers extend 1.5 times the interquartile range from the 25th and 75th percentiles, and outliers are represented by dots. n = 252, 252, and 251 sample points. (C) Expression landscapes of the vector providing GUT1 integration sequences linearized with SwaI sorted by specific/nonspecific integration. Hence, the first third of the data from panel A is shown in a rearranged fashion. Transformants were replica plated in glycerol-containing medium after growth on glucose for 60 h to test for specific/nonspecific integration. Note that the GUT1-SacI and STD-SacI integrating vectors cannot be tested for correct integration in this way. (D) The same data from panel C are shown as a boxplot (59). Center lines show the medians, and box limits indicate the 25th and 75th percentiles as determined by R software. Whiskers extend 1.5 times the interquartile range from the 25th and 75th percentiles, and outliers are represented by dots; the width of the boxes is proportional to the square root of the sample size. n = 158 and 94 sample points.

