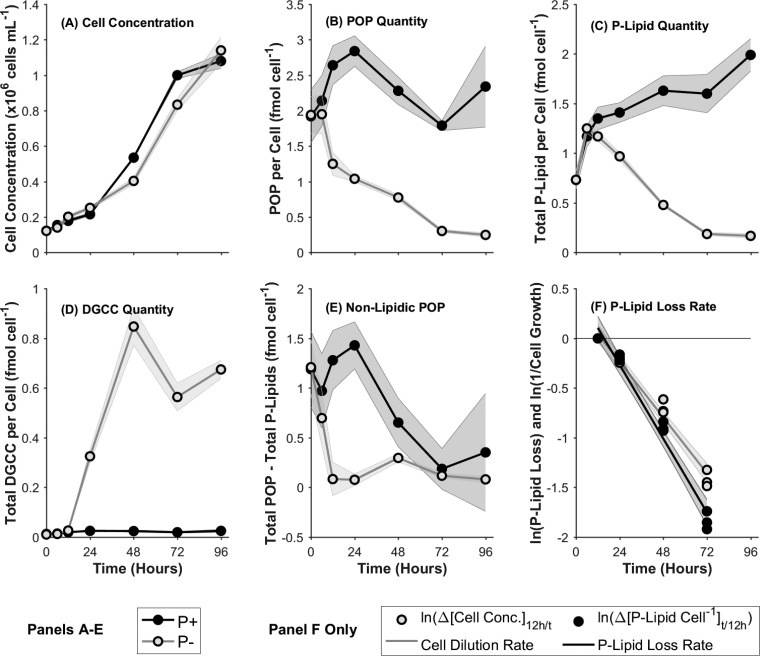
FIG 1.
(A to E) Growth curve (expressed as cell concentrations) (A), quantity of particulate organic phosphorus (POP) per cell (B), total phospholipid (P-Lipid) (C), total DGCC (D), and quantity of nonlipidic POP per cell (E) in phosphorus-replete (P+) and phosphorus-stressed (P−) cultures, with the progression of time. (F) Rate of loss of total phospholipids in comparison with the cell dilution rate. Values are relative to those at 12 h, observed as the time of initiation of P stress, and consequently DGCC biosynthesis and P-lipid substitution/degradation, in P− cultures. Data are means for three biological replicates; shaded regions indicate 1 standard deviation.

