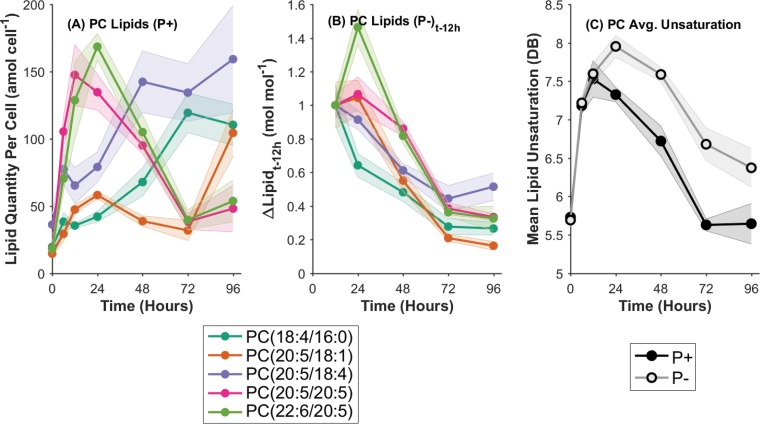
FIG 3.
(A) Quantities of the five most abundant individual PC lipid molecular species per cell, over time, in P+ control cultures only. (B) Changes in the concentrations of the top five PC lipid molecular species between the initiation of P stress (12 h) and the time indicated (t) in P− cultures only. (C) Average unsaturation of the total PC lipid pool in P+ and P− treatments with the progression of time. DB, double bonds. Data are means for three biological replicates; shaded regions indicate 1 standard deviation.

