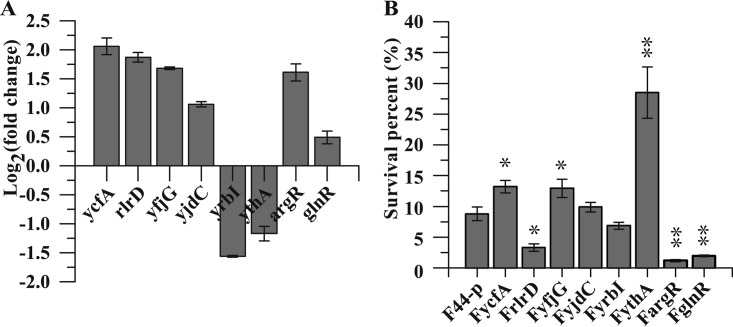
FIG 1.
(A) Relative transcription levels of eight regulators under acid shock analyzed by qRT-PCR. The fold changes of qRT-PCR were normalized using 16S rRNA as an internal control gene. The error bars, indicating standard deviations (SD), are from three replicate flasks. (B) Acid tolerance of the strains overexpressing transcriptional regulators. The survival percentage was the ratio of the CFU per milliliter counted after the acid challenge to the CFU/ml at T0 (start of the challenge). Cells were cultured in fermentation medium (pH 7.2) and challenged in fermentation medium (pH 3.0). Error bars indicate the SD of three independent experiments. *, P < 0.01; **, P < 0.001 (t test).

