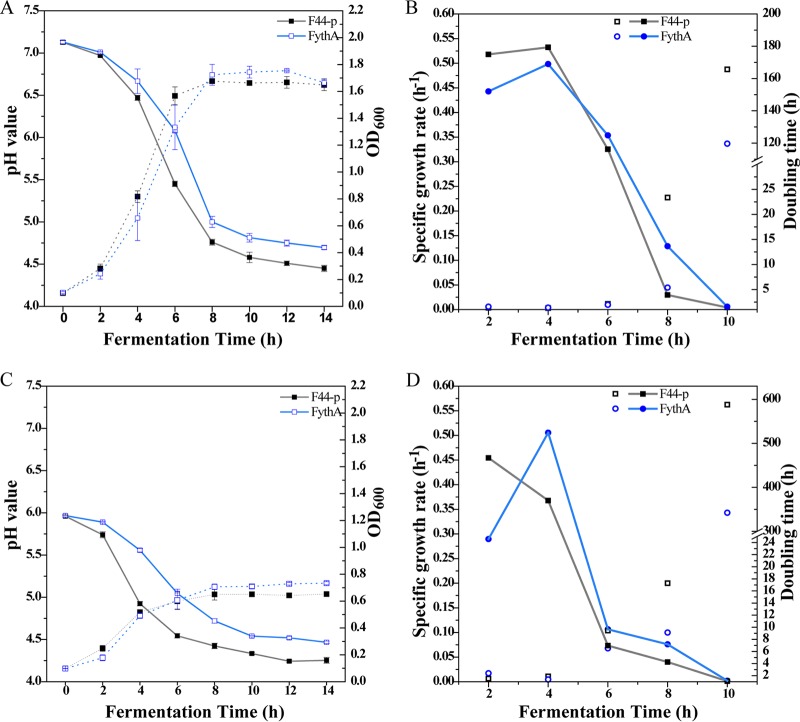
FIG 2.
Physiological characteristics of a ythA-overexpressing strain. (A) Cell density (dashed lines) and pH value (solid lines) during fermentation at the initial pH 7.2. OD600 indicates the optical density measured at 600 nm. (B) Specific growth rate and doubling time during fermentation at the initial pH 7.2. (C) Cell density (dashed lines) and pH value (solid lines) during fermentation at the initial pH 6.0. OD600 indicates the optical density measured at 600 nm. (D) Specific growth rate and doubling time during fermentation at the initial pH 6.0.

