
FIG 1.
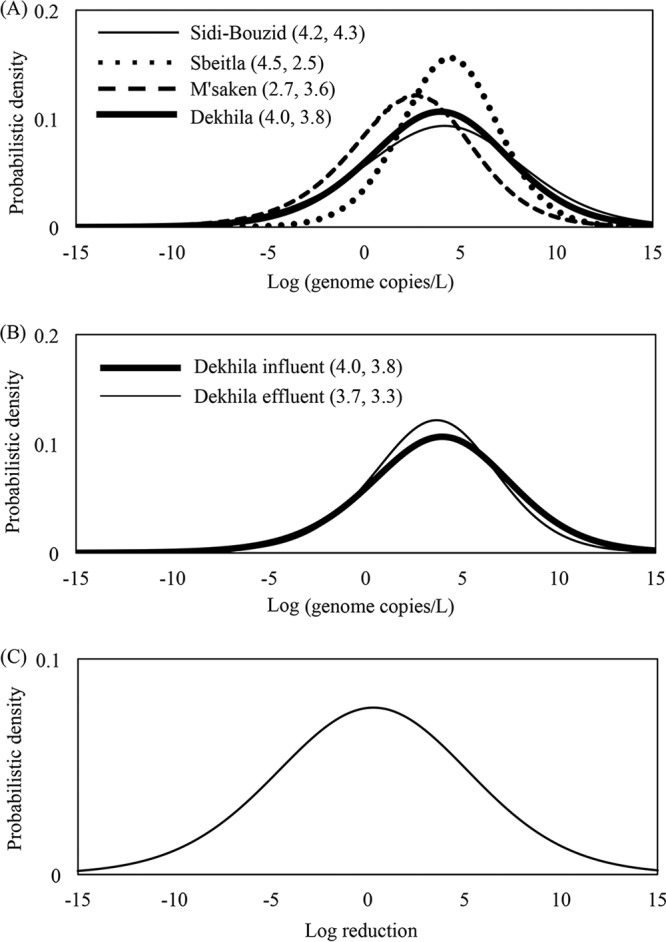
Posterior predictive distributions of sapovirus (SaV) density in all the WWTP influents (A) and in influent and effluent from the Dekhila plant (B) (numbers in parentheses indicate logarithmic mean values and standard deviations). (C) Log-ratio virus removal in the Dekhila WWTP.