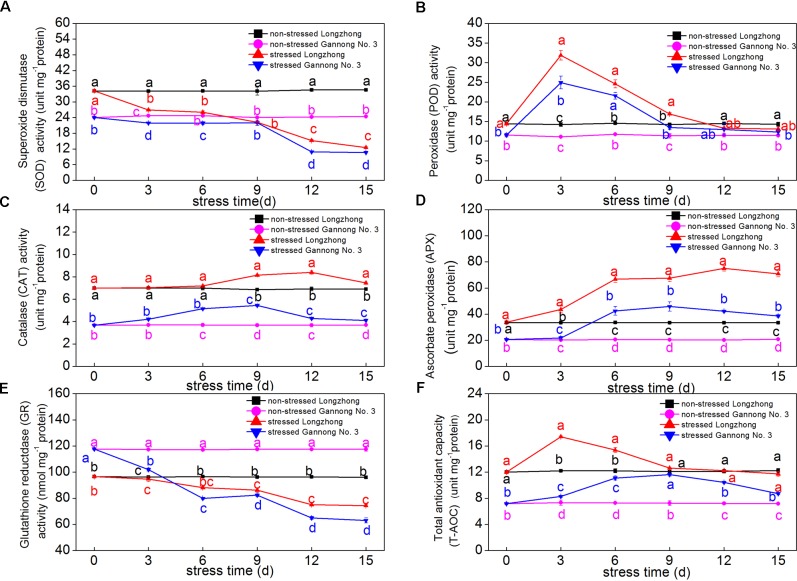
FIGURE 3.
Changes of the activities of antioxidant enzymes (SOD, POD, CAT, APX, and GR) (A–E) and total antioxidant capacity (T-AOC) (F) in two alfalfa varieties under non-stressed and stressed conditions at different time points. Different letters above line graphs indicate significant difference among treatments at a given day of treatment (P ≤ 0.05), and vertical bars indicate ± SE of mean (n = 3).

